 Download PDF
Market Overview
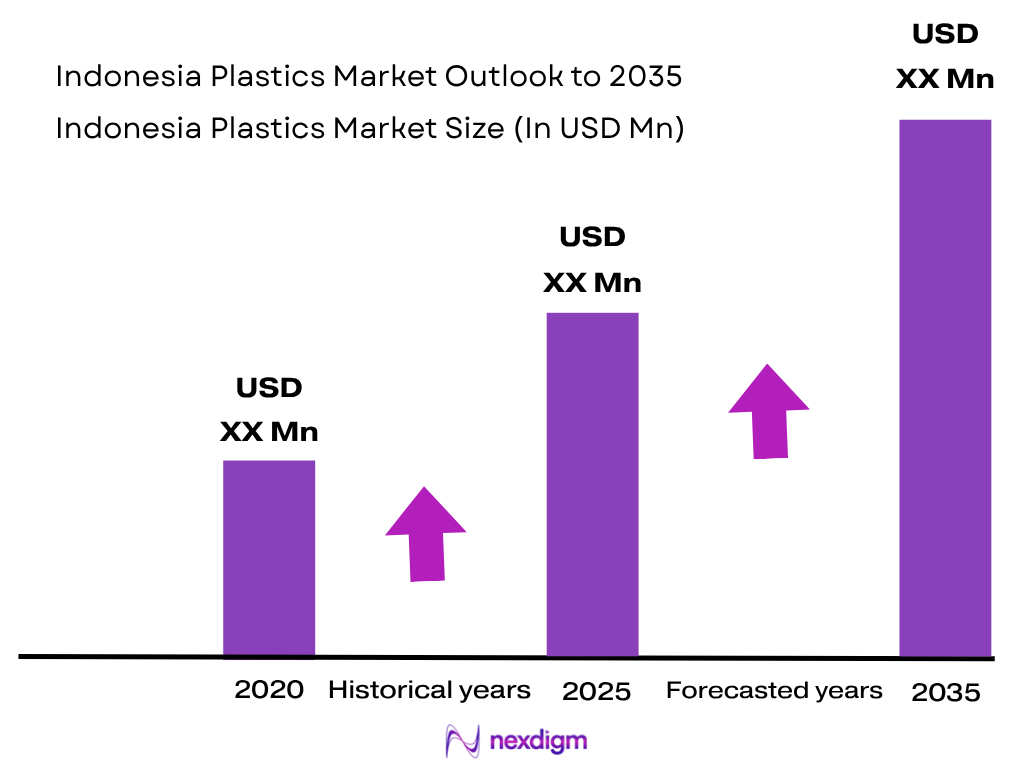
The Indonesia Plastics Market is valued at approximately USD ~XX billion, supported by packaging, construction, automotive, electronics and household-product demand. Domestic polymer supply remains concentrated: a major integrated producer’s polyethylene output moved from 650 KT to 445 KT, while polypropylene output moved from 517 KT to 441 KT across the two latest reporting periods. Indonesia’s GDP reached IDR 22,139 trillion, sustaining a large downstream manufacturing and consumer base.
Cilegon–Banten, Greater Jakarta, Tangerang, Indramayu and the broader Java industrial corridor dominate Indonesia’s plastics ecosystem because they combine petrochemical plants, converters, ports, logistics infrastructure and major consumer-product manufacturing clusters. Cilegon hosts polyethylene capacity of 736 KTA and polypropylene capacity of 590 KTA, while a newer petrochemical complex covers 110 hectares with investment of IDR 59.37 trillion. Banten’s economy reached IDR 873.63 trillion, strengthening its position as Indonesia’s principal polymer-production hub.
Market Segmentation
By Supply Origin
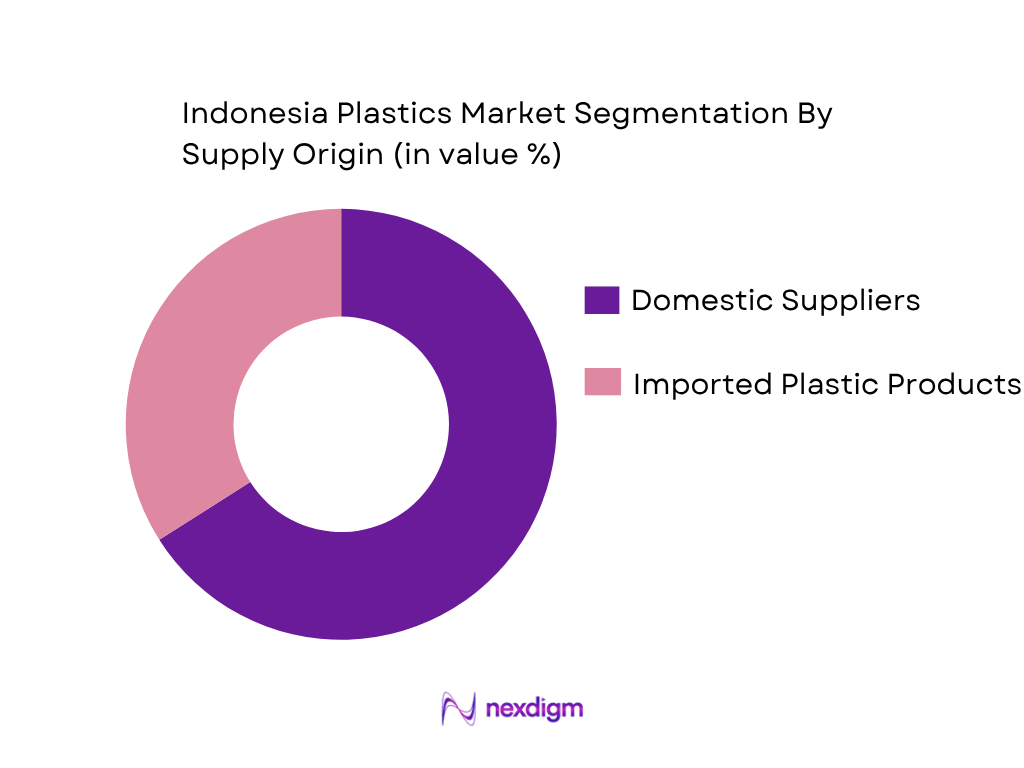
The Indonesia Plastics Market is segmented by supply origin into domestically supplied plastic products and imported plastic products. Domestic supply holds the dominant position because Indonesia has an established base of resin manufacturers, packaging converters, pipe producers, compounders and moulded-plastics manufacturers concentrated primarily on Java. Integrated domestic production reduces lead times for high-volume grades, particularly PE, PP and PVC, and allows converters to maintain local inventories for FMCG, packaging and construction customers. Indonesia’s largest polyolefin producer operates 736 KTA of polyethylene capacity and 590 KTA of polypropylene capacity, while another domestic producer operates 450 KTA of polyethylene capacity. Local supply is further supported by PVC and PET producers in Banten and Tangerang. Nevertheless, imports remain structurally important because domestic capacity does not fully cover the diversity and volume of resin and finished-product requirements, particularly specialty grades and engineering materials. In the plastic-products industry, domestic suppliers accounted for 66.1% of demand, compared with 33.9% supplied through imports.
By Buyer Type
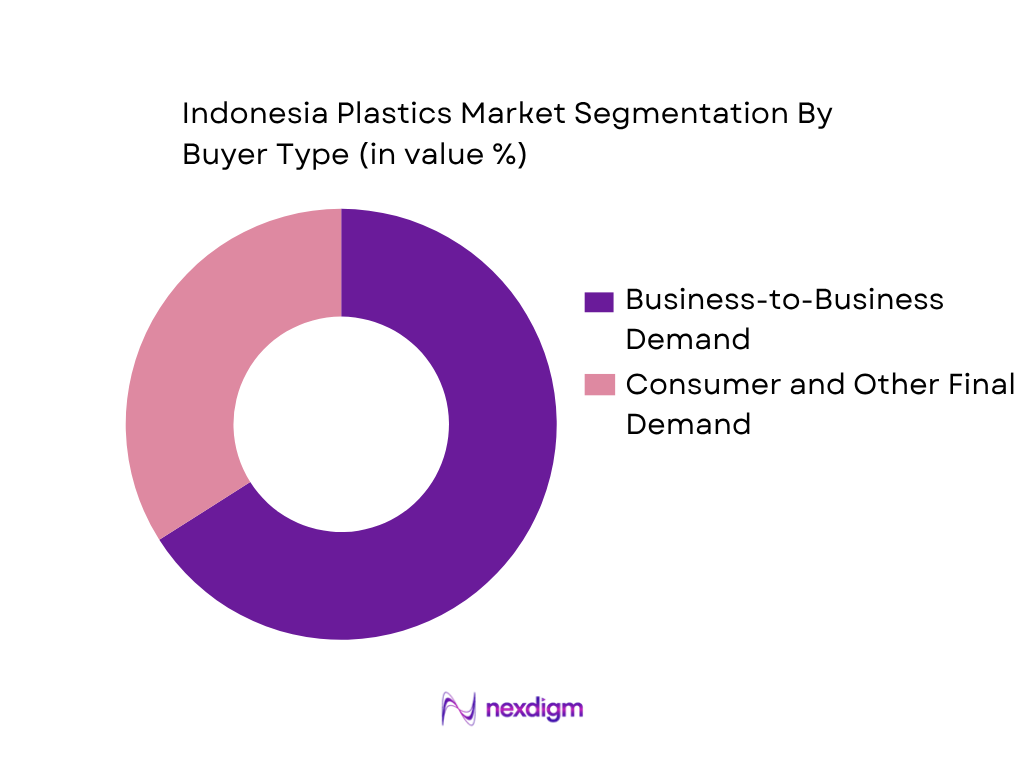
The Indonesia Plastics Market is segmented by buyer type into business-to-business demand and consumer-oriented demand. Business-to-business demand dominates because plastics are primarily purchased as intermediate materials, components or packaging inputs rather than as standalone consumer materials. Converters purchase PE, PP, PVC, PET and engineering polymers for films, bottles, pipes, automotive components, appliance housings, industrial containers and other manufactured products. Packaging converters alone require continuous resin supply for Indonesia’s large food, beverage, personal-care and household-product industries. Construction companies consume PVC and HDPE through pipes, profiles and infrastructure applications, while automotive and electrical manufacturers require technical compounds. This industrial structure explains why B2B expenditure represented 89.5% of total plastic-products demand, compared with 10.5% attributable to other final-demand channels. The dominance is reinforced by Indonesia’s manufacturing economy and its extensive converter network, which transforms primary polymers into thousands of finished products before they reach consumers.
Competitive Landscape
The Indonesia Plastics Market combines large integrated petrochemical producers with specialized PP, PVC and PET manufacturers. Chandra Asri Group has a particularly strong position in domestic PE and PP production, while LOTTE Chemical Titan Indonesia supplies major polyethylene grades. Polytama Propindo specializes in polypropylene, whereas Asahimas Chemical and Sulfindo Adiusaha provide integrated vinyl-chain products. Competitive advantage depends on installed capacity, upstream feedstock integration, polymer-grade breadth, plant proximity to Java converters, technical support and the ability to reduce Indonesia’s dependence on imported resin.
| Company | Establishment Year | Headquarters | Primary Polymer Portfolio | Indonesia Production Footprint | Installed Polymer Capacity | Feedstock Integration | Major End-Use Exposure | Strategic Market Position |
| Chandra Asri Group | 1984 | Jakarta, Indonesia | ~ | ~ | ~ | ~ | ~ | ~ |
| LOTTE Chemical Titan Indonesia | 1987 | Jakarta, Indonesia | ~ | ~ | ~ | ~ | ~ | ~ |
| PT Polytama Propindo | 1993 | Jakarta, Indonesia | ~ | ~ | ~ | ~ | ~ | ~ |
| PT Asahimas Chemical | 1986 | Jakarta, Indonesia | ~ | ~ | ~ | ~ | ~ | ~ |
| PT Sulfindo Adiusaha | 1987 | Jakarta, Indonesia | ~ | ~ | ~ | ~ | ~ | ~ |
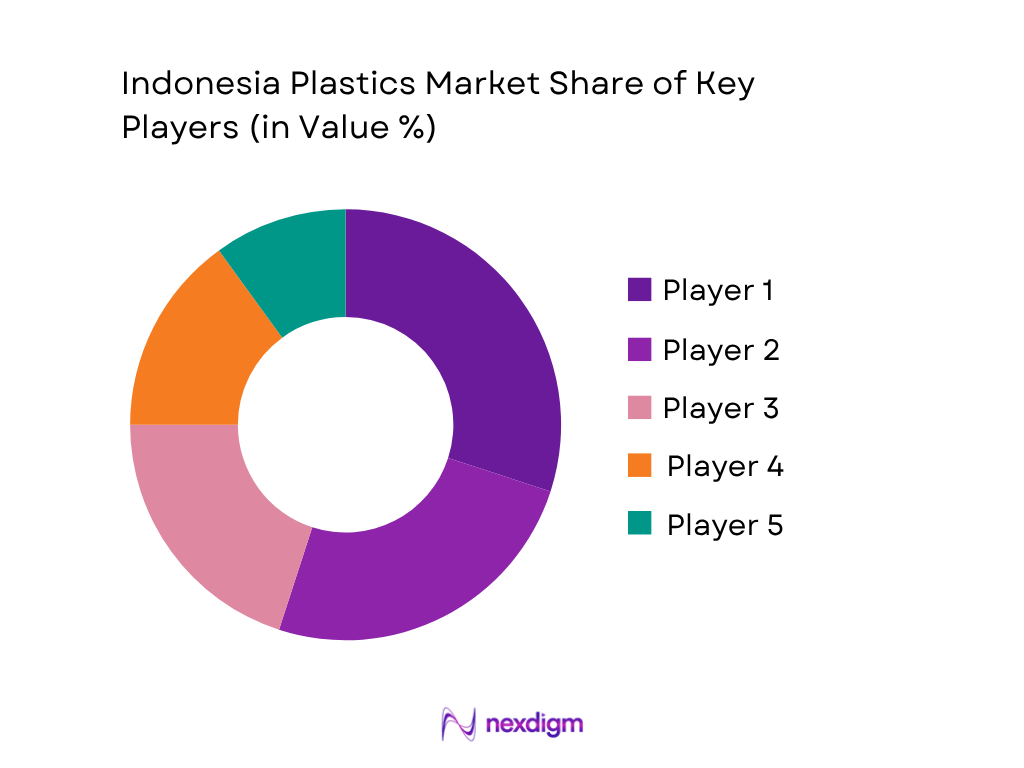
Indonesia Plastics Market Analysis
Growth Drivers
Expansion of Domestic Petrochemical and Polyolefin Production Base
Indonesia’s plastics market is being supported by continued strengthening of domestic petrochemical production, which is important because polyethylene, polypropylene and associated olefin feedstocks form the core raw-material base for flexible packaging, rigid containers, pipes, household products, automotive components and industrial plastics. Chandra Asri’s Indonesian production system recorded 480 KT of ethylene, 281 KT of propylene, 441 KT of polypropylene and 445 KT of polyethylene in 2024, together with 193 KT of styrene monomer, 173 KT of butadiene and by-products and 153 KT of Butene-1 and MTBE. The company’s existing production infrastructure includes installed capacities of 900 KTA of ethylene, 736 KTA of polyethylene, 590 KTA of polypropylene, 340 KTA of styrene monomer, 137 KTA of butadiene and 128 KTA of MTBE, providing an integrated domestic platform for supplying multiple downstream plastic-processing activities. Additional supply-side reinforcement arrived through the integrated petrochemical complex inaugurated in Cilegon in 2025, whose new ethylene plant has 1,000 KTA of production capacity. This expansion materially strengthens the availability of basic petrochemical feedstocks used to manufacture polymer resins and reduces the structural constraint created when Indonesian converters must depend on overseas supply chains for essential raw materials. Indonesia also has another established polyethylene producer operating 450,000 tonnes of annual installed PE capacity, producing HDPE and LLDPE grades used for packaging films, industrial sacks, containers, rotationally moulded products, wire and cable insulation and general moulded applications. The scale of these assets is especially relevant given Indonesia’s macroeconomic base: the economy generated approximately USD 1.4 trillion of GDP in 2024, GDP per capita reached USD 4,925.4, and the population stood at 283,487,931 people.
Large Packaging, FMCG and Plastic-Conversion Material Flow
Indonesia’s large consumer base and extensive packaged-goods ecosystem create a strong demand platform for polyethylene, polypropylene, PET and other packaging polymers. Formal producer reporting for 2024 identified 934,659.36 tonnes of potential plastic waste generation associated with participating manufacturing companies, while realized plastic waste generation reached 372,707.57 tonnes. These figures are important for the plastics market because packaging waste largely originates after polymers have already passed through resin production, converting, filling, distribution and consumption stages, meaning that waste volumes provide a direct indication of the scale of material moving through FMCG and packaging supply chains. During the same reporting period, manufacturers recorded 196,921.74 tonnes of planned plastic-waste reduction activity and achieved 193,778.18 tonnes of realized plastic-waste reduction, demonstrating that substantial quantities of packaging material are already entering formal reduction, recovery, redesign and recycling programs. The wider producer-reporting framework covered 37 manufacturing companies, reinforcing the relevance of plastic packaging in packaged foods, beverages, personal care, household products and other mass-consumption categories. Indonesia’s polymer-production base is aligned with this demand structure. Domestic facilities include 736 KTA of polyethylene capacity and 590 KTA of polypropylene capacity at one major integrated complex, while another polyethylene producer operates 450,000 tonnes of annual installed capacity. These materials are central to flexible films, pouches, bottle caps, closures, containers, woven sacks, heavy-duty bags, household products and injection-moulded packaging. Indonesia’s macroeconomic fundamentals further support the scale of these consumption chains. GDP reached approximately USD 1.4 trillion in 2024, GDP per capita stood at USD 4,925.4, and the national population reached 283,487,931 people. The combination of a population exceeding 283 million people and a trillion-dollar economy generates large recurring volumes of food, beverage, household-care and personal-care purchases that require plastic protection, containment, transport and shelf-life functionality.
Market Challenges
Domestic Resin Supply Constraints and Uneven Petrochemical Output
A key challenge for Indonesia’s plastics market is that substantial installed polymer and petrochemical capacity does not automatically translate into equivalent annual output available to converters. Chandra Asri operated facilities with installed capacities of 900 KTA of ethylene, 736 KTA of polyethylene and 590 KTA of polypropylene, but actual 2024 production amounted to 480 KT of ethylene, 445 KT of polyethylene and 441 KT of polypropylene. Production of other key intermediates included 281 KT of propylene, 193 KT of styrene monomer, 173 KT of butadiene and by-products and 153 KT of Butene-1 and MTBE. These figures highlight the importance of operating continuity, feedstock availability, plant maintenance and cracker utilization for downstream plastics suppliers. A converter producing films, bottles, injection-moulded goods, pipes or household products requires a consistent flow of specific resin grades, not merely nominal national production capacity. Indonesia does have an additional domestic polyethylene facility with 450,000 tonnes of annual installed capacity, but this production is concentrated in HDPE and LLDPE, meaning many downstream applications still require access to a wider assortment of PE, PP, engineering thermoplastics and specialty compounds. The opening of the new Cilegon integrated petrochemical complex in 2025 added 1,000 KTA of ethylene capacity, which strengthens the upstream base but also illustrates the scale of infrastructure required to close domestic feedstock gaps. The Indonesian plastics industry therefore faces a transition period in which new capacity is entering the system while converters must continue managing grade-specific availability, operational fluctuations and supply-chain continuity. The issue is particularly relevant for packaging manufacturers that require consistent melt-flow characteristics, film clarity, sealability and mechanical properties and for automotive or electrical manufacturers that need certified engineering formulations. Indonesia’s macroeconomic scale intensifies this supply challenge because the country had USD 1.4 trillion of GDP, USD 4,925.4 of GDP per capita and a population of 283,487,931 people in 2024. Such a large economic and demographic base supports extensive consumption of packaged food, beverages, construction materials, household goods, electrical products and vehicles, all of which place demand on domestic polymer supply.
Plastic Waste Collection, Recovery and Recyclate Quality Gap
Indonesia’s plastics market faces a significant circularity challenge because the quantity of plastic entering the waste stream remains materially larger than the quantity recorded as successfully reduced through formal producer programs. In 2024, participating manufacturers reported 372,707.57 tonnes of realized plastic waste generation, while realized plastic-waste reduction activities totaled 193,778.18 tonnes. Planned plastic-waste generation within the same system was 934,659.36 tonnes, while planned reduction activity totaled 196,921.74 tonnes. The reporting framework covered 37 manufacturing companies, indicating that even among companies actively participating in formal producer-responsibility mechanisms, large volumes of plastic still require collection, segregation, recovery, recycling or alternative treatment. For the plastics industry, this challenge is not simply about the existence of waste. Mechanical recyclers require material streams with sufficiently consistent polymer composition, contamination levels, color, moisture content and physical properties to produce usable rPET, rHDPE, rLDPE or rPP pellets. Flexible packaging is particularly difficult because pouches, multilayer films, labels, inks, adhesives and food residues complicate polymer separation and reduce usable recyclate yield. Indonesia’s geography adds another market-specific constraint: collecting small volumes of post-consumer plastic from dispersed islands and transporting them economically to sorting, washing and pelletizing facilities creates a different operating challenge from markets with highly centralized urban waste systems. At the same time, Indonesia has a large underlying consumption base. The country’s population reached 283,487,931 people in 2024, GDP amounted to approximately USD 1.4 trillion, and GDP per capita reached USD 4,925.4. These figures support continuing consumption of packaged goods, household products, beverages and durable plastic products and therefore sustain the physical flow of plastic into municipal and commercial waste streams. The challenge for recyclers is converting that volume into specification-grade feedstock suitable for converters.
Market Opportunities
High-Quality Recycled Polymer and Closed-Loop Packaging Development
Indonesia has a significant opportunity to expand high-quality recycled polymers because the country already generates substantial recoverable plastic volumes while formal waste-reduction mechanisms are becoming more established. In 2024, manufacturers participating in the producer-performance system recorded 372,707.57 tonnes of realized plastic waste generation and 193,778.18 tonnes of realized plastic-waste reduction activity. The same system identified 934,659.36 tonnes of potential plastic waste generation and 196,921.74 tonnes of planned plastic-waste reduction, creating a measurable material base that can support future investment in collection, sorting, washing, flake production, pelletizing and closed-loop recycling. Rather than relying on future waste forecasts, these current quantities demonstrate that enough physical plastic already flows through Indonesia’s manufacturing and packaging ecosystem to support expansion of specialized recycling infrastructure. The opportunity is especially relevant for PET bottles, HDPE containers, PE films and PP packaging, where polymer streams can be recovered and converted into secondary raw materials when contamination is controlled. Indonesia’s scale provides additional justification for investment: GDP reached approximately USD 1.4 trillion in 2024, GDP per capita was USD 4,925.4, and the national population stood at 283,487,931 people. This combination supports a very large base of beverage, packaged-food, personal-care, household-care and consumer-product demand, which continuously generates post-consumer packaging feedstock. The opportunity is therefore not limited to collecting more plastic; higher economic value can be created by improving the quality of recovered material. Investments in near-infrared sorting, color separation, hot washing, decontamination, odor removal, melt filtration and advanced pelletizing can allow recyclers to sell materials into more demanding packaging and industrial applications.
Engineering Plastics and Higher-Value Automotive Polymer Applications
Indonesia’s automotive manufacturing base creates a strong opportunity for plastics suppliers to move from commodity resins toward engineering compounds, lightweight components and application-specific formulations. Domestic vehicle production reached 1,196,664 units in 2024, including 1,026,976 passenger vehicles and 169,688 commercial vehicles. Domestic wholesales totaled 865,723 vehicles, indicating a large manufacturing and distribution ecosystem that requires polymer components across interiors, exterior trims, dashboards, bumpers, battery housings, electrical connectors, under-hood systems, lighting assemblies, fluid reservoirs and cable management. These applications consume polypropylene compounds, ABS, polyamide, PBT, polycarbonate blends, thermoplastic elastomers and reinforced plastics rather than only basic packaging-grade polymers. Indonesia’s upstream supply base provides an important starting point for this shift. Domestic production included 441 KT of polypropylene and 445 KT of polyethylene in 2024, while existing installed capacities include 590 KTA of PP and 736 KTA of PE. Another producer operates 450,000 tonnes of annual PE capacity, and the new Cilegon petrochemical facility added 1,000 KTA of ethylene capacity in 2025. These volumes create a broader petrochemical platform from which compounders can develop higher-performance grades for transportation applications. The macroeconomic environment also supports further industrialization: Indonesia recorded approximately USD 1.4 trillion of GDP in 2024, GDP per capita of USD 4,925.4, and a population of 283,487,931 people. The domestic manufacturing base therefore has sufficient scale to support specialized compounders, moulders, tooling suppliers and component manufacturers. The opportunity is particularly significant as vehicle architecture becomes more electrically intensive. Even without relying on future production forecasts, current vehicle output of more than 1.19 million units demonstrates a substantial addressable component-manufacturing base. Plastics suppliers can target glass-fiber-reinforced PP for structural components, PA grades for heat-resistant applications, PBT and polyamide for electrical connectors, flame-retardant materials for electronic systems and PC blends for lighting and housing components.
Future Outlook
The Indonesia Plastics Market is expected to expand at approximately ~X.X% CAGR during 2026-2035, supported by domestic petrochemical investment, packaged-goods consumption, infrastructure development, automotive manufacturing and progressive localization of resin production. Market development will increasingly depend on the interaction between conventional polymer demand and circular-economy requirements.
One of the most important structural changes is the expansion of domestic petrochemical capacity in Cilegon. A new integrated complex backed by approximately USD 3.9 billion of investment has been positioned as a major downstream-industry catalyst for plastics, textiles, automotive materials and packaging. This investment strengthens Indonesia’s ability to substitute imported petrochemical intermediates and improve domestic availability of feedstocks required by converters.
Major Players
- Chandra Asri Group
- LOTTE Chemical Titan Indonesia
- LOTTE Chemical Indonesia
- PT Polytama Propindo
- PT Asahimas Chemical
- PT Sulfindo Adiusaha
- PT Indorama Ventures Indonesia
- PT Petnesia Resindo
- PT Indonesia Toray Synthetics
- Dynapack Asia
- PT Berlina Tbk
- PT Panca Budi Idaman Tbk
- PT Impack Pratama Industri Tbk
- PT ALBA Tridi Plastics Recycling Indonesia
- PT Veolia Services Indonesia
Key Target Audience
- Petrochemical and Plastic Resin Producers
- Plastic Converters, Compounders and Masterbatch Manufacturers
- Plastic Packaging Manufacturers and FMCG Brand Owners
- Polymer Importers, Distributors and Trading Companies
- Automotive, Electronics, Construction and Industrial Product Manufacturers
- Plastic Recycling, Waste Collection and Circular Economy Companies
- Investments and Venture Capitalist Firms
- Government and Regulatory Bodies (Ministry of Industry, Ministry of Environment, Ministry of Investment and Downstream Industry/BKPM, National Standardization Agency of Indonesia, National Food and Drug Authority/BPOM)
Research Methodology
Step 1: Identification of Key Variables
The initial phase constructs a complete ecosystem map for the Indonesia Plastics Market, covering petrochemical producers, resin importers, distributors, compounders, converters, recyclers and end-use manufacturers. Critical variables include PE, PP, PVC and PET capacity, resin imports, converter demand, application mix, recycling flows and regional industrial concentration. Industry publications, customs information, government statistics and corporate operating data are used to define the analytical framework.
Step 2: Market Analysis and Construction
Historical market construction applies both top-down and bottom-up methodologies. The top-down approach evaluates domestic resin production, imports, exports and plastic-product manufacturing, while the bottom-up approach assesses individual producer capacities, utilization, converter throughput and end-use requirements. Polymer flows are reconciled across packaging, construction, automotive, electronics, consumer products and agriculture to minimize double counting and establish a consistent market baseline.
Step 3: Hypothesis Validation and Expert Consultation
Market hypotheses are validated through computer-assisted telephone interviews and structured discussions with resin manufacturers, converters, distributors, packaging producers, recyclers and procurement executives. Discussions evaluate production utilization, resin sourcing, domestic-versus-imported procurement, technical grade requirements, recycling constraints and customer qualification processes. Primary feedback is compared with published operational statistics to identify inconsistencies and refine assumptions used in segmentation and forecasting.
Step 4: Research Synthesis and Final Output
The final phase combines primary insights with secondary evidence to develop a reconciled Indonesia Plastics Market dataset. Domestic polymer capacity is assessed against converter demand and imports, while waste collection and recycled-material supply are integrated into the material-flow framework. Forecast scenarios incorporate petrochemical localization, packaging demand, recycling development, construction activity and engineering-plastics adoption to produce the final competitive, segmentation and long-term market outlook.

- Executive Summary
- Research Methodology (Market Definition and Scope, Indonesia Plastics Market Classification, Polymer Resin Demand Assessment, Domestic Petrochemical Capacity Mapping, Virgin and Recycled Polymer Supply Assessment, Plastic Conversion Industry Mapping, Import Dependency Analysis, End-Use Polymer Consumption Assessment, Plastic Waste Material Flow Analysis, Mechanical Recycling Capacity Assessment, Circular Plastics Ecosystem Evaluation, Top-Down Market Sizing, Bottom-Up Converter Demand Assessment, Primary Industry Interviews, Trade Flow Reconciliation, Data Triangulation and Forecasting Framework)

- Definition and Scope
- Indonesia Plastics Industry Evolution and Development of Domestic Petrochemical and Plastic Conversion Ecosystem
- Polymer Production, Resin Import, Compounding, Conversion, Distribution, Collection and Recycling Industry Structure
- Indonesia Plastics Market Value Chain Analysis
- Indonesia Plastics Market Supply Chain Analysis
- Naphtha, Olefins, Polyolefins, PVC, PET, Styrenics, Engineering Plastics, Recycled Resin and Additives Ecosystem Analysis
- Domestic Resin Production and Import Dependency Assessment

- Growth Drivers (Expansion of Food and Beverage Packaging Demand, Growth of FMCG Consumption, Development of Domestic Petrochemical Capacity, Expansion of Construction and Infrastructure Applications, Automotive and Electronics Manufacturing Growth, Increasing Recycled Polymer Adoption, Expansion of Modern Retail and E-Commerce Packaging Demand)
- Market Challenges (High Dependence on Imported Plastic Resins, Domestic Petrochemical Feedstock Constraints, Plastic Waste Collection Fragmentation, Limited High-Quality Recycled Feedstock Availability, Multilayer and Sachet Recycling Complexity, Virgin and Recycled Resin Quality Differential, Informal Waste Collection Integration Challenges, Logistics Constraints Across the Indonesian Archipelago)
- Market Opportunities (Domestic Polyolefin Capacity Expansion, High-Quality Recycled PET and Polyolefin Production, Food-Grade Recycled Resin Development, Mono-Material Flexible Packaging, Closed-Loop FMCG Packaging Systems, Engineering Plastic Compounding, Plastic Waste Sorting and Recycling Infrastructure, Bio-Based and Alternative Polymer Development)
- Market Trends (Petrochemical Import Substitution, Post-Consumer Recycled Resin Adoption, Lightweight Packaging, Mono-Material Packaging Development, Flexible Packaging Redesign, Refill and Reuse Models, Digital Polymer Procurement, Advanced Mechanical Recycling, Circular Polymer Traceability)
- Government Regulations (Ministry of Environment Producer Waste Reduction Roadmap, Extended Producer Responsibility Framework, Packaging Recovery Organization Framework, National Circular Economy Roadmap, Plastic Waste Reduction Requirements, Food-Contact Packaging Standards, Indonesian National Standards for Plastic Products, Import and Trade Regulations for Polymer Resin and Plastic Waste)
- SWOT Analysis
- Porter’s Five Forces Analysis
- PESTLE Analysis
- Stakeholder Ecosystem
- Competition Ecosystem

- By Market Value (2020-2025)
- By Polymer Consumption Volume (2020-2025)
- By Domestic Plastic Resin Production Volume (2020-2025)
- By Plastic Resin Import Volume (2020-2025)
- By Virgin Plastic Consumption Volume (2020-2025)
- By Recycled Plastic Consumption Volume (2020-2025)
- By Plastic Conversion Volume (2020-2025)
- By Average Polymer Selling Price (2020-2025)

- By Polymer Type (In Value %)
Polyethylene (PE)
High-Density Polyethylene (HDPE)
Low-Density Polyethylene (LDPE)
Linear Low-Density Polyethylene (LLDPE)
Polypropylene (PP)
PP Homopolymer
PP Random Copolymer
PP Impact Copolymer
Polyvinyl Chloride (PVC)
Polyethylene Terephthalate (PET)
Polystyrene (PS) and Expanded Polystyrene (EPS)
Acrylonitrile Butadiene Styrene (ABS)
Polyamide (PA)
Polycarbonate (PC)
Polybutylene Terephthalate (PBT)
Other Engineering and Specialty Plastics - By Material Source (In Value %)
Virgin Fossil-Based Plastics
Post-Consumer Recycled Plastics
Post-Industrial Recycled Plastics
Mechanically Recycled Plastics
Chemically Recycled Plastics
Bio-Based Plastics
Biodegradable and Compostable Plastics - By Processing Technology (In Value %)
Injection Moulding
Blown Film Extrusion
Cast Film and Sheet Extrusion
Blow Moulding
Thermoforming
Pipe and Profile Extrusion
Rotational Moulding
Foam Processing
Compounding and Masterbatching
Fiber and Filament Processing
Additive Manufacturing - By End-Use Industry (In Value %)
Packaging
Flexible Plastic Packaging
Rigid Plastic Packaging
Food and Beverage Packaging
Household and Personal Care Packaging
Building and Construction
Automotive and Transportation
Electrical and Electronics
Consumer and Household Goods
Agriculture
Textiles and Fibers
Healthcare and Medical
Industrial and Machinery Applications - By Product Form (In Value %)
Polymer Pellets and Granules
Plastic Compounds
Masterbatches
Plastic Films
Plastic Sheets
Plastic Bottles and Containers
Pipes and Profiles
Fibers and Filaments
Plastic Foams
Moulded Plastic Components - By Circularity Route (In Value %)
Mechanical Recycling
Chemical Recycling
Closed-Loop Recycling
Open-Loop Recycling
Post-Consumer Recycling
Post-Industrial Recycling
Reuse and Refill Systems
Waste-to-Resource Plastic Recovery - By Sales Channel (In Value %)
Direct Sales from Domestic Polymer Producers
Polymer Importers and Trading Companies
Authorized Polymer Distributors
Compounders and Masterbatch Suppliers
Plastic Converters
OEM and Tier-1 Procurement Networks
Recycled Resin Suppliers
Digital Petrochemical Procurement Platforms - By Region (In Value %)
Java
Greater Jakarta and Banten
West Java
Central Java
East Java
Sumatra
Kalimantan
Sulawesi
Bali and Nusa Tenggara
Maluku and Papua

- Market Share of Major Players (By Revenue, Polymer Type, Resin Production Capacity, Domestic Production Footprint, End-Use Industry, Virgin and Recycled Plastics Portfolio, Distribution Network, Import and Export Exposure)
- Cross Comparison Parameters (Indonesia Polymer Production Footprint and Installed Capacity, Polymer and Resin Portfolio Breadth, Domestic Feedstock Integration Capability, Virgin-to-Recycled Product Portfolio, Plastic Conversion and Compounding Capability, End-Use Industry Exposure, Circularity and EPR Readiness, Domestic Distribution and Inter-Island Supply Reach)
- SWOT Analysis of Major Players
- Competitive Positioning Matrix
- Polymer Grade and Product Portfolio Benchmarking
- Domestic Production versus Import Supply Benchmarking
- Petrochemical Integration and Feedstock Security Assessment
- Manufacturing, Compounding and Plastic Conversion Capability Assessment
- Detailed Profiles of Major Companies
Chandra Asri Group
LOTTE Chemical Titan Indonesia
LOTTE Chemical Indonesia
PT Polytama Propindo
PT Asahimas Chemical
PT Sulfindo Adiusaha
PT Indorama Ventures Indonesia
PT Petnesia Resindo
PT Indonesia Toray Synthetics
Dynapack Asia
PT Berlina Tbk
PT Panca Budi Idaman Tbk
PT Impack Pratama Industri Tbk
PT ALBA Tridi Plastics Recycling Indonesia
PT Veolia Services Indonesia

- Plastic Converter Resin Procurement Assessment
- Packaging Manufacturer Polymer Requirement Analysis
- FMCG and Brand Owner Plastic Demand Assessment
- Automotive Component Manufacturer Polymer Requirement Analysis
- Building and Construction Plastic Consumption Assessment
- Electrical and Electronics Polymer Demand Assessment
- Virgin versus Recycled Resin Preference Assessment
- Polymer Supplier Selection Analysis
- Plastic Packaging Sustainability Requirement Assessment
- Domestic versus Imported Polymer Procurement Analysis

- By Market Value (2026-2035)
- By Polymer Consumption Volume (2026-2035)
- By Domestic Plastic Resin Production Volume (2026-2035)
- By Plastic Resin Import Volume (2026-2035)
- By Virgin Plastic Consumption Volume (2026-2035)
- By Recycled Plastic Consumption Volume (2026-2035)
- By Plastic Conversion Volume (2026-2035)
- By Average Polymer Selling Price (2026-2035)


 Request a Sample
 Ask for Customization
 Get a Quote
 Enquire Now