

Effective asset management fee benchmarking research enables investment firms to compare pricing across active and passive investment products while balancing performance, operating costs, investor expectations, and profitability. Through specialized Pricing Analysis Services, asset managers can assess management expense ratios, advisory fees, performance charges, distribution costs, and competitor pricing.
Detailed fee benchmarking supports active fund pricing analysis, passive fund cost comparison, investment product positioning, and client value assessment. It also helps identify pricing gaps, margin opportunities, and fee compression risks. By applying market intelligence, product segmentation, profitability analysis, and pricing optimization, firms can build transparent, competitive, and sustainable asset management fee structures.
Nexdigm’s Pricing Analysis Services helped an asset manager optimize active and passive fund fees, achieving a 14% increase in revenue, 11% improvement in margins, 13% stronger investor retention, and 10% growth in product adoption.
Pricing Analysis for Active and Passive Asset Management Products
Pricing analysis enables asset managers to evaluate active and passive product fees, market competitiveness, investor value, profitability, cost structures, and positioning through specialized Pricing Analysis Services and benchmarking insights. Some major elements in focus are:
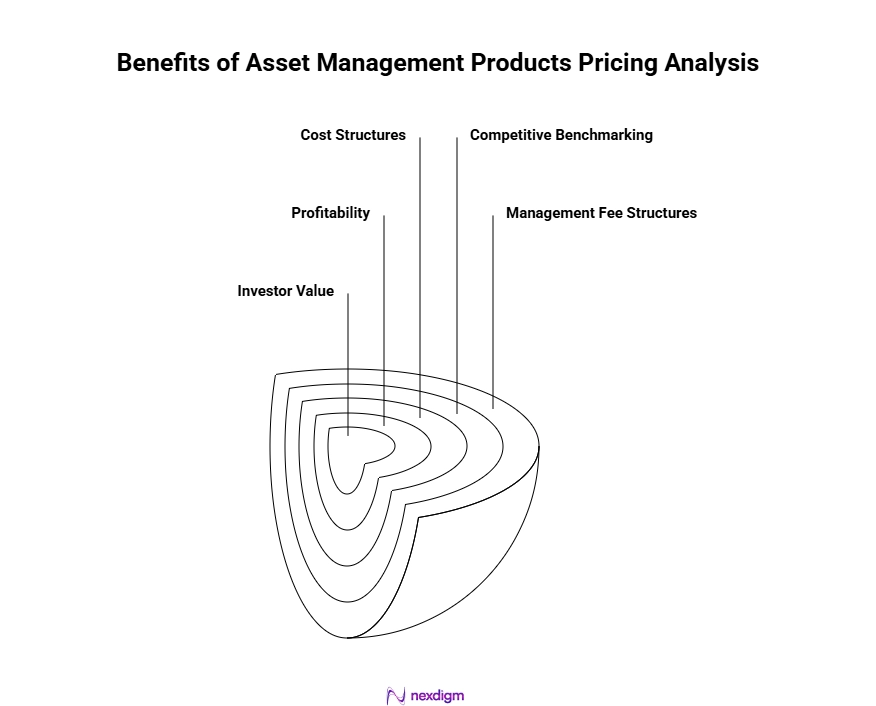
- Management Fee Structures: Evaluate management fees across active and passive products to determine whether pricing reflects investment complexity, portfolio oversight, operating costs, distribution requirements, and investor expectations.
- Performance and Return Expectations: Assess historical performance, benchmark-relative returns, risk-adjusted outcomes, and investment consistency to understand whether active product fees remain justified compared with lower-cost passive alternatives.
- Competitive Fee Benchmarking: Compare expense ratios, advisory charges, performance fees, and service inclusions against relevant competitors to identify pricing gaps, market pressures, and opportunities for differentiation.
- Product Cost Economics: Analyze investment management, administration, compliance, technology, distribution, and client servicing costs to establish sustainable fees that protect margins without reducing product competitiveness.
- Investor Segmentation: Segment investors by portfolio size, risk appetite, investment objectives, service expectations, and price sensitivity to support differentiated pricing across active and passive products.
Nexdigm’s Role in Optimizing Asset Management Fee Structures
Nexdigm supports asset managers in optimizing fee structures through specialized Pricing Analysis Services, competitive fee benchmarking, market intelligence, and profitability analysis. Its expertise covers active and passive fund pricing, expense ratio comparison, investor segmentation, cost assessment, and pricing optimization. This data-driven approach helps firms improve fee transparency, strengthen product positioning, protect margins, enhance investor value, and achieve sustainable revenue growth.
Nexdigm’s Data-Driven Framework for Investment Product Fee Benchmarking
Nexdigm’s framework combines market intelligence, competitor research, product economics, investor segmentation, and Pricing Analysis Services to establish competitive, transparent, and sustainable fees across active and passive investment products. Data Driven steps followed by Nexdigm’s experts are:
Step 1: Define the Benchmarking Scope
Identify investment products, geographic markets, investor segments, fee components, and competitor groups to establish clear parameters for focused and relevant benchmarking.
Step 2: Collect Market and Competitor Data
Gather management fees, expense ratios, performance charges, distribution costs, minimum investments, and service features from comparable active and passive investment products.
Step 3: Standardize Fee Information
Normalize fee data across product structures, currencies, asset classes, and disclosure formats to ensure accurate comparisons and eliminate inconsistencies within benchmarking datasets.
Step 4: Segment Investment Products
Classify products by strategy, asset class, risk profile, investor type, distribution channel, and management style to support meaningful fee comparisons.
Step 5: Evaluate Product Economics
Assess operating costs, portfolio management expenses, distribution requirements, service intensity, scalability, and margin contribution to determine sustainable pricing levels for each product.
Nexdigm’s Case
Nexdigm’s Pricing Analysis Services helped an asset manager benchmark active and passive product fees, delivering 15% revenue growth, 12% stronger margins, 13% higher investor retention, and 11% increased product adoption through clearer, competitive pricing decisions.
To take the next step, simply visit our Request a Consultation page and share your requirements with us.
Harsh Mittal
+91-8422857704