

Two automotive suppliers may manufacture the same component while operating with very different business models, production capabilities and market positions. One may serve several large OEMs through multiple manufacturing facilities, while another may specialise in a narrower product category with a smaller but technically advanced production base. Comparing these businesses requires more than a review of prices or company size.
India’s automotive component industry recorded turnover of approximately ₹6.73 lakh crore in FY2024–25. According to ACMA, supplies to OEMs reached ₹5.70 lakh crore, registering 10% year-on-year growth. The industry also exported components worth US$22.9 billion. The scale and diversity of this market make supplier benchmarking relevant for OEMs, component manufacturers and investors evaluating the competitive position of individual businesses.
Commercial Performance: Understanding the Business Behind the Component
Commercial benchmarking examines the financial and market characteristics that influence a supplier’s ability to participate in an automotive programme.
Revenue is a useful starting point, but consolidated turnover can be misleading when a manufacturer operates across automotive and non-automotive businesses. The automotive contribution should be separated wherever disclosures allow. Product-level revenue is even more useful because it indicates the supplier’s actual position in the category being assessed.
Other commercial indicators include customer concentration, export exposure, product diversification, investment activity and market positioning. A supplier dependent on a single OEM or vehicle platform may have a different commercial risk profile from one serving multiple manufacturers and vehicle segments.
Pricing comparisons also require context. Differences in product specifications, material grades, manufacturing processes and production volumes can make direct price comparisons unreliable. Benchmarking should identify the cost drivers behind a supplier’s position rather than assume that the lowest quoted price represents the most competitive manufacturer.
Technical Capabilities: Comparing Suppliers Within the Same Category
Technical benchmarking should be specific to the component being evaluated. Comparing a manufacturer of precision gears with a producer of vehicle lighting systems through identical technical indicators would produce limited insight.
For forged and machined components, the assessment may examine metallurgical expertise, tooling, machining precision, material processing and production specialisation. For electrical systems, relevant capabilities include electronic manufacturing, wiring architecture, sensor integration and testing infrastructure.
Engineering resources are another important differentiator. Suppliers with established product-development capabilities may be better positioned to support design modifications, platform changes and new product requirements. Their experience with comparable applications can also indicate whether their technical expertise is relevant to the buyer’s programme.
Certifications and quality-system credentials provide useful evidence of process maturity. However, they should be evaluated alongside product-specific capabilities, customer approvals and testing infrastructure.
Operational Metrics: Capacity, Location and Production Flexibility
Operational benchmarking examines whether a supplier’s manufacturing network can support the buyer’s expected requirements.
Installed capacity provides an indication of production scale, but it does not necessarily represent capacity available for a new programme. Utilisation, product mix, equipment compatibility and expansion plans should also be considered. A facility operating close to its practical production limit may have less flexibility to absorb additional demand.
Manufacturing geography influences logistics and regional sourcing options. India’s automotive industry has established clusters around Pune, Chennai, NCR, Gujarat and Madhya Pradesh. The location of a supplier relative to vehicle assembly plants, industrial infrastructure and upstream manufacturers can affect its commercial attractiveness.
Auto parts supplier benchmarking brings these commercial, technical and operational indicators into a consistent comparison. The purpose is to identify where suppliers have genuine advantages, where their capabilities differ and which manufacturers merit further evaluation.
What a Useful Supplier Benchmark Should Reveal
A benchmarking exercise should produce more than a ranked list. It should explain the reasons behind each supplier’s position and distinguish between category leaders, specialist manufacturers and businesses with limited relevance to the sourcing requirement.
For example, a diversified supplier may rank strongly on business scale and geographic reach but have a narrower position in a specific technical category. A specialist manufacturer may score more favourably on process expertise while having limited capacity or customer diversification.
The assessment should also account for differences in information availability. Listed companies often provide detailed financial and operational disclosures, while privately held suppliers may disclose considerably less. Missing information should be recorded as a limitation rather than treated as evidence of weak performance.
Auto Parts Supplier Benchmarking Framework
Nexdigm can support comparative supplier assessments through market research, company profiling and structured analysis of manufacturers across relevant product categories.
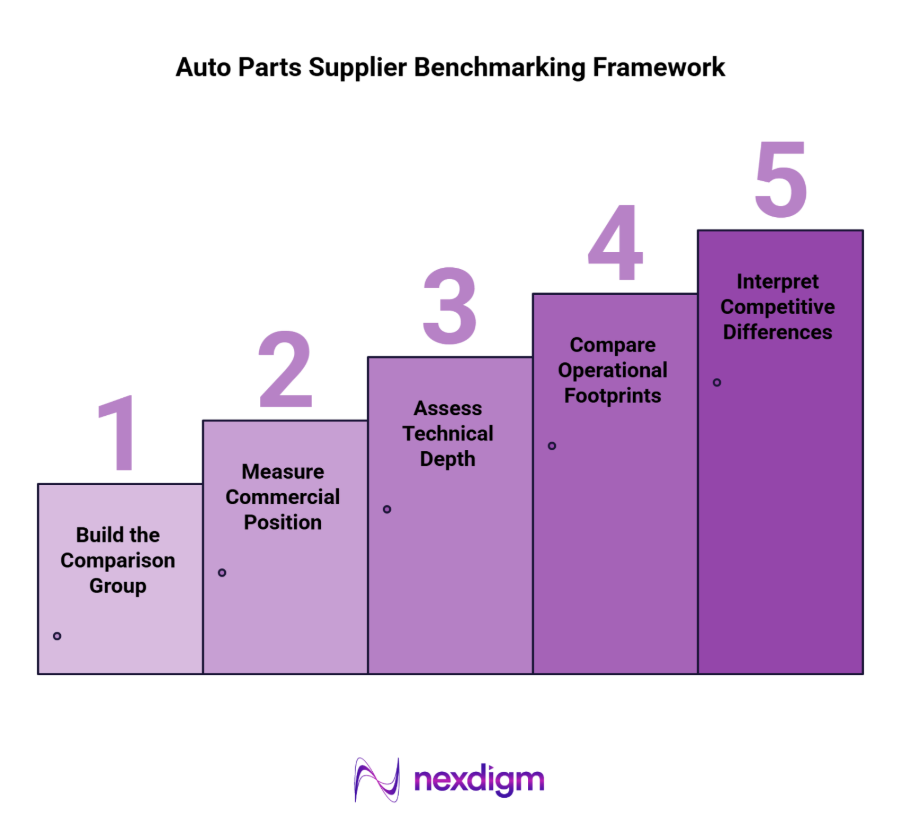
- Build the Comparison Group: Select manufacturers operating in the same component category, vehicle segment or manufacturing process.
- Measure Commercial Position: Compare automotive revenue exposure, customer concentration, export presence, product mix and investment activity.
- Assess Technical Depth: Examine engineering resources, process specialisation, product portfolios and technology capabilities.
- Compare Operational Footprints: Map facilities, capacity indicators, manufacturing clusters and expansion activity.
- Interpret Competitive Differences: Identify category specialists, scale advantages, capability gaps and suppliers requiring further investigation.
Nexdigm Case: Benchmarking a Domestic Supplier Base
A component manufacturer evaluating expansion opportunities needed to compare competitors across four product categories. Nexdigm assessed 31 manufacturers across three regions, examined their market positions and production footprints, and shortlisted seven businesses for closer consideration. The analysis also identified two categories with limited regional competition.
To take the next step, simply visit our Request a Consultation page and share your requirements with us.
Harsh Mittal
+91-8422857704