

Bakery procurement is closely tied to production performance. Flour, sugar, fats, dairy ingredients, yeast, chocolate, fillings, and packaging influence the cost of a finished product, but their purchase prices do not tell the whole story. Ingredient consistency affects recipe yield, packaging affects product protection and shelf life, and supplier reliability determines whether production schedules can be maintained.
A useful bakery benchmark should connect purchasing data with the cost of producing a saleable loaf, cake, pastry, or packaged snack.
Market Signals: Ingredients Do Not Move Together
India’s wheat production reached 117.94 million tonnes in 2024-25, according to government estimates, representing growth of more than 36% since 2014-15. Oilseed production reached 42.99 million tonnes, up approximately 56% over the same period.
However, domestic production does not insulate bakery businesses from every input-price movement. India’s edible-oil import dependence was 56.25% in 2023-24, leaving fats and oils exposed to international supply conditions and exchange-rate changes.
The FAO’s September 2026 data also showed different directions across commodities: cereals were 17.2% higher year on year, vegetable oils 18.3% higher, and sugar 8.5% lower. These international indicators are not direct measures of Indian bakery purchase prices, but they help identify which input categories may need closer monitoring.
Ingredient Benchmarking: What Does Each Supplier Deliver?
The first comparison should be between equivalent specifications. Flour can differ in protein characteristics, moisture, and functional performance. Fats may have different melting and processing properties. Dairy ingredients, yeast, and fillings also need product-specific measures.
A supplier scorecard should examine:
- Price per kilogram or litre, including freight.
- Grade, composition, moisture, and technical specifications.
- Recipe performance and usable batch yield.
- Rejection rates and product consistency.
- Lead times, minimum orders, and supply reliability.
The most useful metric is often ingredient cost per saleable unit rather than purchase price per kilogram. A cheaper input that increases waste or reduces finished-product yield may be a false saving.
Packaging Benchmarking: Cost Per Finished Product
Bakery packaging includes bread bags, cake boxes, trays, labels, cartons, and protective inserts. Costs depend on material, dimensions, printing, tooling, production volume, and delivery.
Compare suppliers using cost per thousand units and packaging cost per finished product. Include damage rates, storage requirements, minimum runs, and the risk of obsolete printed stock. Standardising packaging formats across product lines may improve buying leverage, but not where it compromises product protection or presentation.
Supplier Performance: Reliability Affects Production Cost
A bakery can incur costs when ingredients arrive late, quality varies between batches, or packaging fails during production. These issues may lead to line interruptions, rejected products, emergency purchases, and missed orders.
Supplier benchmarking should therefore include capacity, on-time delivery, fill rates, complaint resolution, technical support, and backup arrangements. For bakery procurement benchmarking reports, price comparisons should be supported by operational evidence rather than treated as standalone rankings.
Bakery Procurement Benchmarking Framework
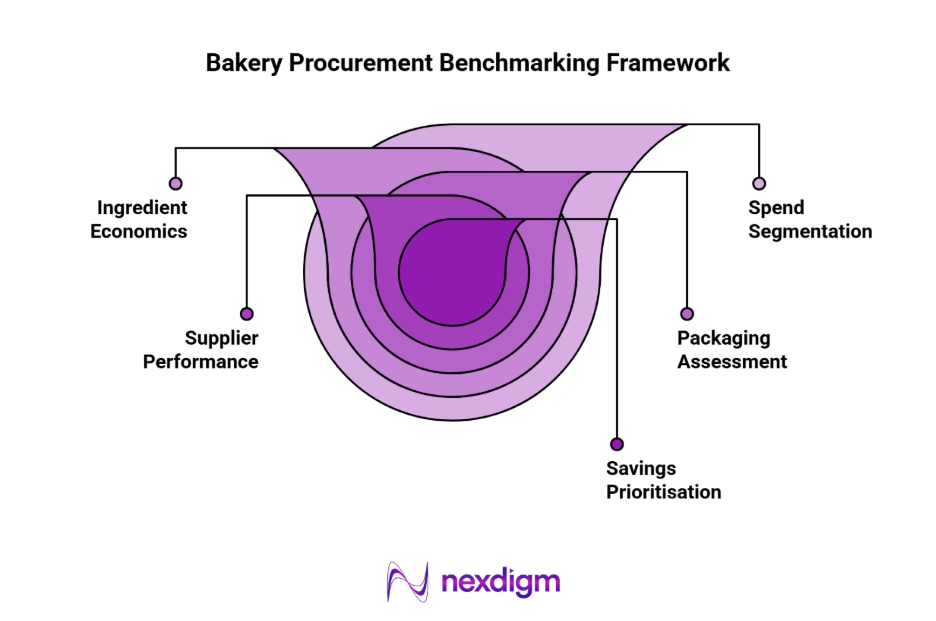
- Spend Segmentation: Rank ingredient and packaging expenditure by product line, supplier, production site, and purchase frequency.
- Ingredient Economics: Compare equivalent grades and calculate cost per saleable unit using recipe yield, wastage, and rejection data.
- Packaging Assessment: Benchmark material, dimensions, printing, minimum runs, freight, and consumption per finished product.
- Supplier Performance: Measure quality consistency, delivery reliability, capacity, lead times, and responsiveness.
- Savings Prioritisation: Evaluate negotiation, specification alignment, order consolidation, and alternative sourcing against production impact and implementation risk.
Where Savings Are Most Likely
Routine ingredients with multiple qualified suppliers may be suitable for competitive bidding. Packaging can offer opportunities through standardisation and improved order planning. Specialised ingredients require more caution because substitutions may affect recipes, shelf life, or customer acceptance.
Procurement teams should also examine demand forecasting. Buying ingredients in larger quantities to obtain discounts can create expiry and storage costs if production plans change. A realistic benchmark includes these costs rather than treating the supplier discount as the final saving.
Nexdigm’s Case Study
A packaged bakery manufacturer was evaluating expansion into new product categories but faced uncertainty around ingredient availability and regional price differences. Nexdigm assessed 5 major ingredient categories across 8 Indian markets, analysing production capacity, supplier concentration, import exposure and demand. The study identified 3 priority markets and potential ingredient-cost advantages of 9–13%, supporting the client’s category expansion strategy.
To take the next step, simply visit our Request a Consultation page and share your requirements with us.
Harsh Mittal
+91-8422857704