
India’s freight network is becoming more interconnected, but the underlying cargo flows remain highly uneven. In 2025, road transport accounted for 66% of India’s estimated 4,661 billion tonne-kilometres of freight movement, compared with 22% for rail and 8% for waterways. Air represented only a fraction of total freight by volume, but its role is concentrated in time-sensitive and high-value cargo.
For transport operators, logistics companies and infrastructure investors, the opportunity therefore lies in understanding where cargo originates, where it is consumed, what it is worth, how frequently it moves and what service level it requires.
The Cargo Flow Comes Before the Mode
Mode selection begins with the cargo rather than the transport asset.
Bulk commodities, industrial inputs and containerised goods behave differently from electronics, pharmaceuticals or urgent spare parts. Shipment frequency also matters. A high-volume, predictable flow can support rail or coastal movement, while fragmented shipments may remain better suited to road.
The first question is therefore: what is moving, in what quantity, between which origins and destinations?
What Is Moving, and From Where to Where?
India’s freight geography reflects its industrial and consumption structure. Manufacturing clusters, ports, agricultural production centres, mining regions and major consumption markets generate different combinations of freight demand.
Rail already carries substantial volumes of coal, iron ore, cement, food grains and containers. Indian Railways recorded 1.67 billion tonnes of freight loading in FY2025–26, while the Eastern and Western Dedicated Freight Corridors are carrying more than 440 trains a day.
The opportunity is therefore corridor specific. A manufacturer shipping regularly from an industrial cluster to a distant distribution centre presents a different modal opportunity from a retailer replenishing stores across nearby cities.
Distance Changes the Mode Economics
Distance changes the cost equation because every mode has a different balance between line-haul efficiency and transfer requirements.
Road remains difficult to displace on shorter or fragmented routes because it offers direct pickup, flexible scheduling and extensive last-mile access. Rail becomes more attractive as shipment volumes and distances increase, particularly where dedicated infrastructure and terminals reduce handling friction.
The DFC network illustrates the effect of infrastructure on this equation. Its 2,843 km of Eastern and Western corridors now handle more than 14% of Indian Railways’ freight traffic despite representing about 4% of the rail network.
For coastal and maritime freight, the relevant comparison may extend across hundreds or thousands of kilometres, particularly where port connectivity and inland distribution can be coordinated efficiently.
High-Value Cargo Creates a Different Opportunity
Volume alone does not reveal the full transport market.
Air freight demonstrates this clearly. Indian air-cargo volumes increased from 2.53 million tonnes in FY2014–15 to 3.72 million tonnes in FY2024-25, with 2.95 million tonnes handled during the first nine months of FY2025–26.
Globally, air-cargo demand rose 8.5% year-on-year in June 2026, with high-value technology products and urgent shipments supporting growth.
For opportunity assessment, cargo value, perishability, urgency and inventory carrying costs can therefore matter as much as physical volume.
Where Road, Rail, Sea, and Air Overlap
The strongest opportunities often occur where two or more modes can credibly serve the same origin-destination flow.
A container moving from a manufacturing cluster to a port may involve road for first-mile collection, rail for the long haul and road again for port or customer delivery. An international electronics shipment may use air for the primary movement while relying on road for regional distribution.
Port activity reinforces this multimodal character. Major Indian ports handled 233.64 million tonnes during April–June 2026, up 6.1% year-on-year, with containerised cargo tonnage rising 9%. JNPA alone handled 36.62 million tonnes between April and July 2026, including nearly 3 million TEUs.
The Untapped Opportunity Is Often Between Modes
Modal opportunity is rarely a simple question of shifting cargo from road to rail, or road to sea.
The larger opportunity may sit in the interfaces: inland terminals, container depots, first- and last-mile links, coastal gateways, airport cargo facilities and multimodal logistics parks. If these connections add too much time or handling cost, a theoretically cheaper mode may remain commercially unattractive.
This is why cargo-flow analysis must examine the complete journey rather than comparing headline freight rates. A cargo transportation market opportunity study can identify corridors where an alternative mode, or a combination of modes, has a commercially viable role.
How Nexdigm Maps Cargo Opportunity Across Transport Modes
Nexdigm can evaluate the market through an origin-destination and corridor-based framework covering:
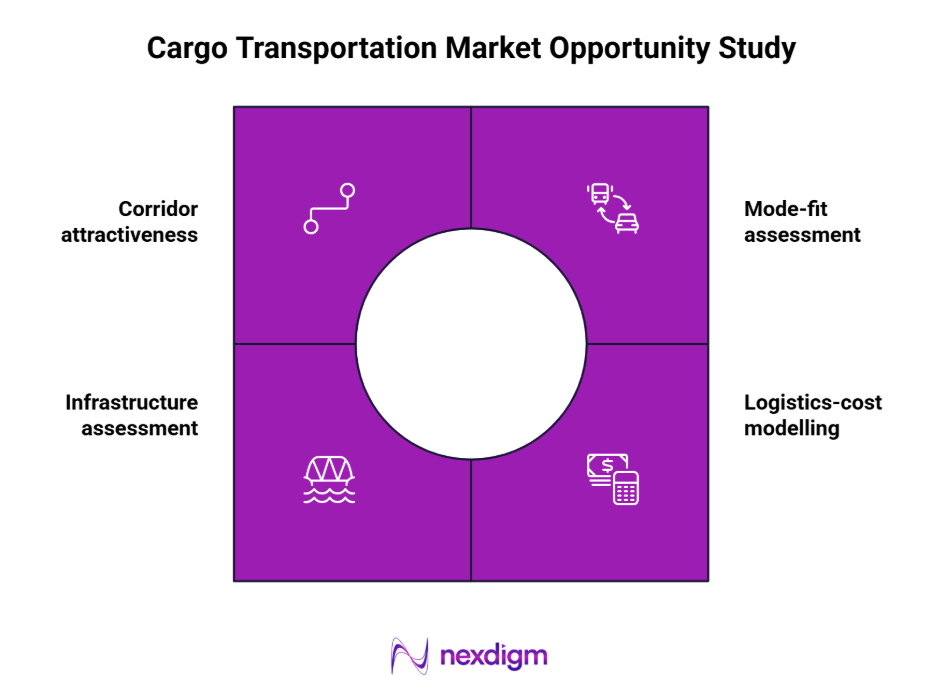
- Cargo flow mapping across industries, products, origins, destinations and shipment frequencies.
- Mode-fit assessment using distance, volume, cargo value, perishability, urgency and service requirements.
- Total logistics-cost modelling across line-haul, first/last mile, handling, terminal and inventory costs.
- Infrastructure assessment covering DFCs, ports, airports, ICDs, logistics parks and multimodal connections.
- Corridor attractiveness scoring based on addressable cargo, competitive intensity, infrastructure readiness, modal substitution potential and expected economics.
The objective is to identify where additional capacity, a new service, a multimodal solution or a different modal mix can capture commercially viable freight demand.
How Nexdigm Identified the Most Attractive Cargo Corridors
In one logistics hub development assessment, Nexdigm evaluated three high-growth trade markets across demand centres, trade corridors, connectivity, infrastructure readiness, operating costs and regulatory considerations. Two locations were shortlisted, with projected distribution costs reduced by 14–16%, delivery coverage improved by 35% and average transit time reduced by nearly 25%.
Such analysis turns cargo-flow data into decisions on where to build capacity, which corridors to target and how different transport modes should work together.
To take the next step, simply visit our Request a Consultation page and share your requirements with us.
Harsh Mittal
+91-8422857704