

Commodity chemical demand is often forecast through industrial production, GDP and historical consumption. Those indicators provide a starting point, but they do not explain the commercial conditions facing producers.
A commodity market can experience growing consumption while producers struggle with margins because capacity is expanding faster than demand. It can also experience flat consumption while specific regions become more attractive because imports rise, domestic capacity closes or material substitution changes the competitive balance.
Nexdigm’s 2026 research describes continuing overcapacity in basic chemicals, with new ethylene and polyethylene capacity expected in the United States and Qatar while China continues adding polypropylene capacity. Europe and parts of Asia face greater cost pressure and lower utilization.
End-Use Demand Creates the Baseline
Commodity chemicals serve broad industrial systems.
Packaging remains a major consumer of polyethylene and polypropylene. Construction absorbs PVC, polyurethane and other materials. Automotive manufacturing uses polymers, synthetic rubber and solvents. Textiles consume large quantities of polyester-chain intermediates.
The supplied research identifies these four end-use systems as important demand pools and highlights packaging, construction, automotive and textiles as the primary downstream pathways for commodity chemicals.
But demand needs to be translated into physical consumption.
For example, packaging growth can be offset by lightweighting. Construction demand can vary with housing and infrastructure cycles. Automotive production can rise while material intensity changes because of vehicle redesign and electrification.
The demand model therefore needs end-use-specific assumptions.
Operating Rates Reveal the Supply Pressure
In asset-heavy commodity chemical markets, operating rates frequently dictate commercial viability just as much as expanding consumption.
The provided sector research points to an 85% to 88% operating benchmark as the historical inflection point for supply tightness and improved profitability, whereas global steam cracker utilization hovered near 76%–80% from 2023 through 2025.
The commercial dynamic is evident.
Whenever nameplate capacity outpaces end-use expansion, plant utilization falls. Depressed operating rates distribute fixed overhead across lower volumes, eroding producer profitability across the value chain.
Conversely, as market demand absorbs excess supply, run rates recover and suppliers regain commercial leverage.
Consequently, evaluating capacity utilization represents a critical pillar of any robust market assessment.
Imports Show Where Demand Exceeds Local Supply
A country with rising consumption is not necessarily an attractive market for a local producer.
If domestic capacity is expanding faster than consumption, imports may decline even while demand grows.
Conversely, a market with moderate consumption growth can become strategically attractive if domestic plants close, production costs rise or capacity fails to keep pace.
The supplied research identifies North America as structurally export-oriented for products such as polyethylene, PVC and methanol, while Europe has become increasingly import-dependent for basic polymers and intermediates. China has simultaneously reduced several historical import deficits through domestic capacity additions.
Trade flows therefore reveal the actual balance between consumption and supply.
Substitution Changes the Demand Pool
Commodity chemical demand also faces material substitution.
Packaging can shift between plastics, paper, glass and aluminium. Virgin polymers can compete with recycled materials. One polymer can substitute for another when pricing and technical requirements permit.
The supplied research identifies recycled-content mandates, extended producer responsibility policies and inter-polymer price spreads as factors that can reshape commodity demand.
Substitution should therefore be included in demand scenarios rather than treated as a separate sustainability issue.
Nexdigm’s Commodity Demand Assessment Map
A structured commodity chemicals demand assessment research exercise can connect demand and supply through a five-layer market map.
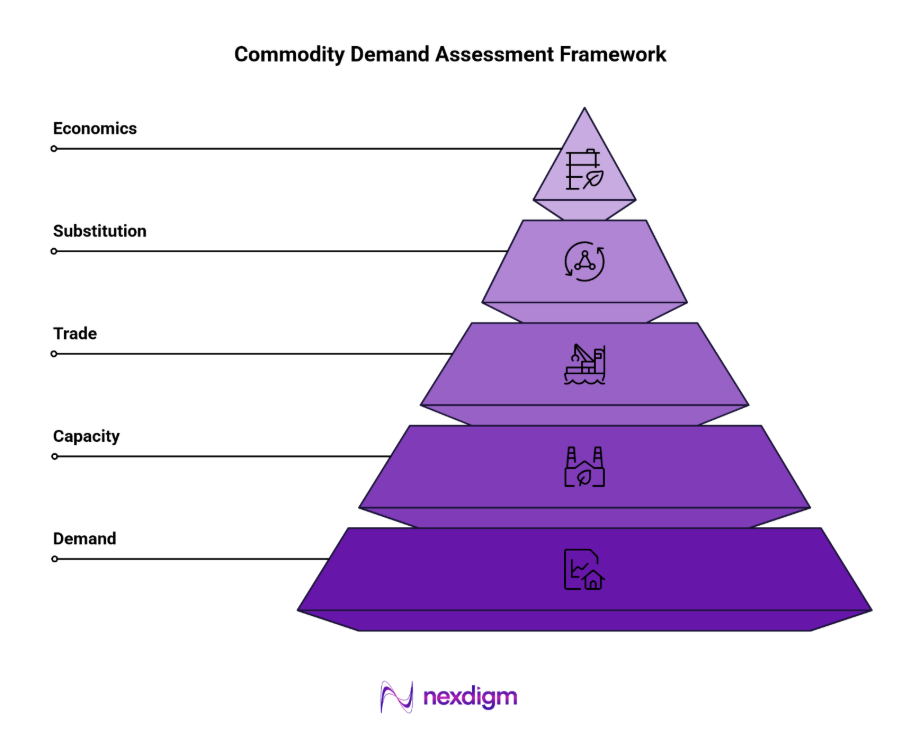
- Demand layer: Estimate consumption by end use and product.
- Capacity layer: Track operating plants, new projects, closures and utilization.
- Trade layer: Map imports, exports and regional trade balances.
- Substitution layer: Measure migration to alternative materials, recycled inputs and competing polymers.
- Economics layer: Assess feedstock, energy, logistics and delivered-cost positioning.
The resulting market view answers a more useful question than “How fast will demand grow?”
It establishes whether incremental demand is sufficient to absorb capacity, whether imports will expand or contract, and which producers are positioned on the competitive cost curve.
Market Growth vs. Margin Deterioration
In periods of structural capacity expansion, market growth can coincide with deteriorating margins. Deloitte expects weak demand recovery and new capacity additions to sustain margin pressure on commodity chemicals, driving further rationalization.
Consequently, producers should not rely on local demand growth alone to trigger investment. Instead, success depends on achieving adequate utilization, maintaining competitive delivered costs, and accessing structurally supply-constrained markets.
Nexdigm Case: Commodity Demand Assessment
A $840M polymer producer evaluated 5 products across 9 markets. Nexdigm mapped 28 end uses, 64 plants and 18 trade corridors, finding demand growth of 3.8% but capacity growth of 6.2%, signalling prolonged margin pressure.
To take the next step, simply visit our Request a Consultation page and share your requirements with us.
Harsh Mittal
+91-8422857704