

Commodity chemicals operate on a different commercial logic from differentiated specialties. Scale, feedstock access, operating rates, logistics and global trade flows can determine profitability as much as end-market demand.
Products such as ethylene, propylene, aromatics, methanol, caustic soda and base polymers serve enormous downstream markets, but their commoditized nature makes pricing highly sensitive to incremental capacity and the position of the marginal producer.
The current market illustrates the problem. Nexdigm’s research highlights persistent overcapacity in basic chemicals, with new ethylene and polyethylene plants expected in the United States and Qatar while China continues expanding polypropylene capacity.
Consumption growth does not guarantee attractive margins
Commodity chemical demand remains closely tied to industrial production, packaging, construction, durable goods and infrastructure.
Emerging markets can provide stronger volume growth as urbanization and manufacturing expand. Mature markets tend to have slower material intensity because of lightweighting, recycling, efficiency improvements and substitution.
This creates two different opportunities.
The first is volume-led growth in markets where per-capita consumption remains relatively low. The second is value-chain positioning in mature markets where demand may be stable but supply constraints, import dependence or specialized downstream applications create attractive niches.
The supplied research notes that commodity polymers in emerging markets can grow faster than GDP, while mature markets show substantially lower material intensity.
The commercial assessment must therefore separate structural consumption growth from cyclical demand.
Capacity determines the competitive landscape
The supply side is often more decisive.
China’s large-scale integrated refining and petrochemical investments have materially increased domestic production of products such as ethylene, polypropylene, paraxylene and related intermediates. The resulting increase in self-sufficiency has altered traditional trade flows and created additional export pressure in some products.
Europe faces the opposite problem. Cefic reported EU chemical capacity utilization at 75% in the first half of 2026, with basic organic chemicals and polymers among the weakest segments. The organization also reported a widening energy-cost disadvantage relative to the United States.
This creates a market where two producers selling the same chemical may face radically different economics.
One may benefit from integrated refining and low-cost feedstocks. Another may depend on imported naphtha, expensive energy and long-distance logistics.
Trade flows reveal where the market is actually clearing
A commodity chemical market should be analysed as a network of production, consumption and trade rather than as isolated country markets.
The assessment needs to track:
- Production concentration
Identify the countries and companies controlling most of the nameplate capacity. - Import dependence
Determine where domestic production is insufficient and imports establish the marginal supply requirement. - Export availability
Map regions with structural surpluses and the destinations toward which incremental volumes are likely to move. - Logistics economics
Compare freight, storage, port infrastructure, pipeline access and inland transportation costs. - Trade-policy exposure
Assess tariffs, sanctions, carbon-related trade measures and other restrictions that can alter delivered competitiveness.
The research highlights increasing US exports of polyethylene, PVC and methanol toward Latin America, Europe and non-China Asian markets as Chinese self-sufficiency changes established trade patterns.
Pricing follows the cost curve
Commodity chemical prices are strongly influenced by the marginal producer.
When supply is tight, producers can price above variable costs and capture stronger margins. When capacity is abundant, prices can fall toward the cash cost of the least competitive producer.
Feedstock therefore becomes central to market assessment.
US ethane-based producers can have a structural advantage over naphtha-based producers when natural-gas economics are favourable. Integrated Middle Eastern producers can similarly benefit from advantaged feedstocks and export infrastructure.
Europe faces greater exposure to high energy and feedstock costs. Cefic reported that EU gas prices remained substantially above US levels through 2025 and that this disadvantage continued into 2026.
A commodity market assessment needs a cost-curve view
This is where commodity chemicals market assessment consulting can move beyond consumption forecasts.
A useful framework combines four analytical layers.
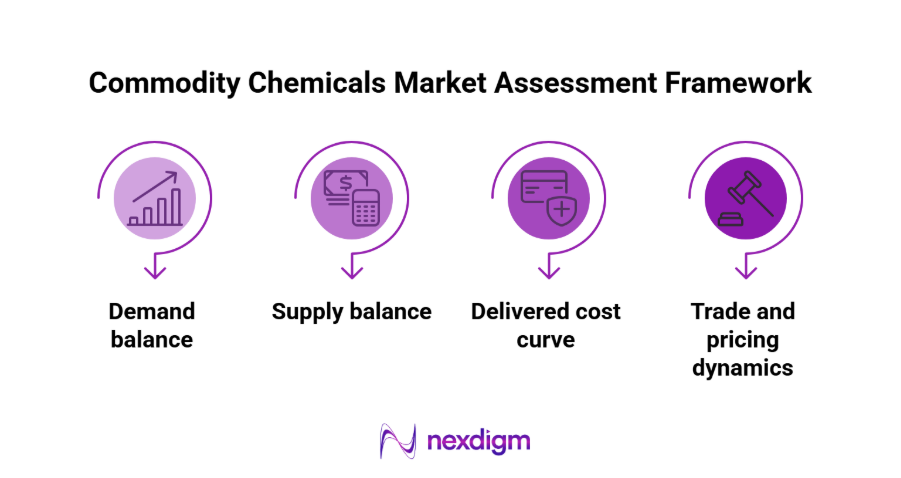
- Demand balance
Forecast consumption by product, end-use sector and geography. Separate baseline demand from incremental demand created by new industrial capacity. - Supply balance
Map current capacity, announced projects, closures, utilization and integration. Calculate the potential surplus or deficit under multiple demand scenarios. - Delivered cost curve
Compare feedstock, energy, conversion, logistics and financing costs across major producing regions. - Trade and pricing dynamics
Model how surplus volumes move between regions and identify the producer likely to set the marginal delivered price.
This creates a more realistic picture of profitability than applying a single market CAGR to current revenues.
Where commodity opportunities can still exist
Commodity chemicals are not uniformly unattractive. Scale, integration and geography can create strong positions.
A producer with advantaged feedstock and export infrastructure can remain competitive even in an oversupplied market. A smaller producer may instead need a protected geographic niche, captive demand, differentiated grades or downstream integration.
Nexdigm points toward continued portfolio rationalization as producers respond to overcapacity and weak margins, strategic question is therefore not simply whether demand is growing. It is whether the company’s cost position, scale and market access allow it to capture that growth profitably.
Nexdigm Case: Commodity Cost-Curve Assessment
A polymer producer with $1.2B revenue evaluated 6 regions and 14 product grades. Nexdigm benchmarked 42 plants across feedstock, logistics and utilization, identifying a 17% cost gap and 3 export markets capable of supporting 9% higher realized margins.
To take the next step, simply visit our Request a Consultation page and share your requirements with us.
Harsh Mittal
+91-8422857704