

Courier demand is becoming increasingly fragmented across documents, e-commerce parcels, B2B consignments, and urgent industrial shipments. These categories differ in shipment size, delivery density, service requirements, and revenue potential.
For courier operators, shipment volume alone is therefore an incomplete measure of market opportunity. A network can add substantial volumes while margins deteriorate if those shipments require repeated delivery attempts, consume disproportionate vehicle capacity, or move through low-density routes. The commercial question is which demand pools are growing, where they are concentrated, and whether they can be served profitably.
E-Commerce Is Changing the Shape of the Shipment
E-commerce has increased shipment frequency while reducing the average size of many consignments. Smaller baskets and more frequent orders have pushed parcel volumes higher, while same-day and next-day promises have compressed the time available for sorting and linehaul operations.
The economics also vary by geography. Metro markets benefit from dense delivery clusters, while Tier-2 and Tier-3 markets can have more dispersed addresses and less efficient return movements. COD shipments add another source of friction through longer doorstep dwell times and higher delivery-failure and return-to-origin costs than prepaid orders.
B2B Demand Has a Different Operating Model
B2B courier movements are generally more predictable than consumer shipments. Industrial components, pharmaceutical samples, diagnostic materials, and replacement parts often move through recurring commercial relationships governed by defined service-level agreements.
Consolidation can also improve route economics. One industrial pickup may contain dozens of packages destined for a small number of commercial locations, while the same number of residential shipments could require dozens of individual stops.
This creates opportunities for dedicated B2B routes around manufacturing clusters and commercial districts. Customers may also pay a premium for defined delivery windows, shipment visibility, specialized handling, and chain-of-custody controls.
Documents May Be Declining Without Becoming Irrelevant
Digital substitution has reduced conventional document volumes, but legal, financial, regulatory, and other sensitive documents can still require physical delivery with security, proof of receipt, and time-definite service.
These shipments show why volume and value cannot be treated as interchangeable. A lightweight document can occupy little network capacity while commanding a premium because the customer is paying for certainty.
Urgent industrial spares follow a similar logic. When a replacement component can prevent production downtime, the value of rapid delivery can substantially exceed the transportation cost.
The Economics Depend on the Cost of Each Stop
Courier profitability is increasingly determined at the delivery-stop level. Dense urban areas can support many completed stops per hour, lowering the cost allocated to each shipment. In dispersed territories, travel time between stops can make the same shipment price uneconomic.
Parcel dimensions create another constraint. Lightweight e-commerce packages with bulky packaging can consume significant vehicle capacity without generating equivalent billable weight. Failed first attempts add costs through re-delivery, additional handling, customer service, and reverse logistics.
Operators therefore need to assess route density, cubic utilization, first-attempt success, cost-to-serve, and contribution margin alongside shipment volumes.
Where Is Demand Becoming Commercially Attractive?
The strongest opportunities tend to combine recurring shipment volumes with either high delivery density or a willingness to pay for specialized service.
Manufacturing clusters, technology parks, healthcare ecosystems, and commercial districts can generate concentrated flows of time-sensitive shipments. Life sciences is particularly relevant where clinical samples and other sensitive materials require controlled packaging, tracking, and expedited transportation.
SMEs can offer another growth pool. Their individual volumes may be smaller than those of large marketplace accounts, but recurring requirements can support stronger yields and customer relationships.
Cross-border express corridors can also command premium pricing where operators provide customs handling, bonded facilities, and end-to-end shipment visibility.
According to Nexdigm Research, Demand Needs to Be Segmented Before It Is Pursued
Nexdigm’s courier logistics market analysis evaluates demand by shipment type, customer, geography, and network economics to distinguish volume growth from commercially attractive growth.
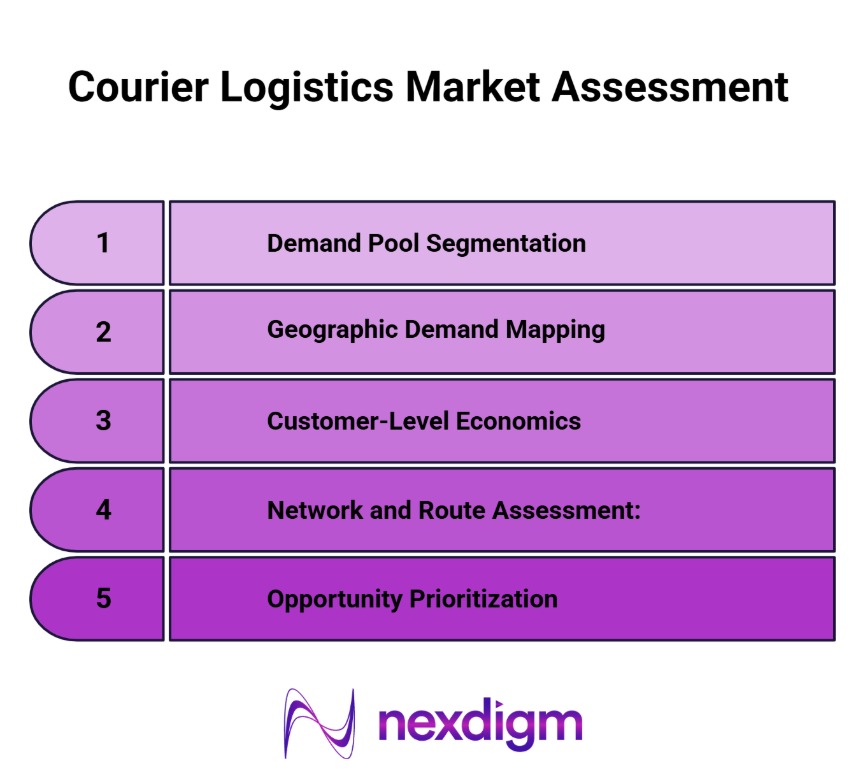
- Demand Pool Segmentation: Assess documents, B2C parcels, B2B consignments, industrial spares, and specialized shipments by volume, weight, frequency, service requirements, and revenue potential.
- Geographic Demand Mapping: Map shipment origins and destinations against hubs, branches, and delivery routes to identify high-density markets and areas where additional volume may remain uneconomic.
- Customer-Level Economics: Calculate revenue and cost-to-serve by account, incorporating linehaul, handling, delivery stops, failed attempts, and reverse logistics.
- Network and Route Assessment: Examine stops per hour, vehicle utilization, delivery density, route overlap, and first-attempt success to determine whether the network can absorb additional demand.
- Opportunity Prioritization: Rank customer segments and corridors by demand growth, margin potential, service requirements, and operational feasibility to guide pricing, fleet allocation, route redesign, and expansion.
How Nexdigm Identifies the Courier Segments Worth Pursuing
A regional courier operator across six metropolitan markets had increased shipment volumes by 24% year-on-year, while operating EBITDA margin declined by 380 basis points. Nexdigm assessed 4.2 million shipment records across 84 branches and 12 customer segments.
The analysis found that sub-1 kg residential e-commerce parcels consumed 58% of network cube utilization but generated a negative 4.2% contribution margin after failed deliveries and service costs. A mid-market industrial segment generated 31% higher gross yield per cubic metre.
Nexdigm separated B2B and residential delivery operations, redesigned delivery beats, and introduced differentiated dimensional-weight and surcharge structures. Within nine months, route density improved 28%, SME customer acquisition costs fell 31%, and operating contribution margin expanded by 410 basis points.
To take the next step, simply visit our Request a Consultation page and share your requirements with us.
Harsh Mittal
+91-8422857704