

Courier demand is expanding, but the composition of that demand is becoming more important than the headline parcel count. E-commerce continues to supply large volumes, yet the market is also being reshaped by SMEs, direct-to-consumer brands, cross-border sellers, returns and increasingly specific delivery expectations.
The scale of the opportunity remains substantial. International Post Corporation reported average parcel-volume growth of 4.4% across 53 postal operators in 2024, following 5.7% growth in 2023. Parcel and express revenue increased 3.8% during the same period. The gap between volume and revenue growth is significant: more parcels are moving through networks, but additional volume does not necessarily produce equivalent revenue. Pricing, customer mix and delivery costs determine how much of that growth becomes commercially useful.
India illustrates the shift particularly clearly. The country’s express parcel market was estimated at 10–11 billion shipments in FY25, with e-commerce accounting for more than half of total shipments. The market is projected to reach 24–29 billion shipments by FY30, with e-commerce shipments expected to grow much faster than traditional courier volumes.
The parcel count hides very different customers
A marketplace shipping millions of standard parcels does not create the same economics as an SME sending a smaller number of higher-value or time-sensitive consignments. The network requirements can also differ substantially.
E-commerce produces density and predictable flows, particularly around major consumption centres. SMEs add fragmentation. They may ship fewer parcels per account, but their combined contribution can create a broad base of recurring demand across industries and geographies. Cross-border sellers add another layer, where customs documentation, tracking continuity and international delivery partnerships become part of the service proposition.
Returns also change the economics. A parcel that travels to a customer and then comes back has generated additional handling, transport and sorting activity without necessarily generating additional revenue. A market assessment that counts outbound shipments alone can therefore overstate the quality of demand.
This is where courier market assessment services need to go beyond market sizing. The useful question is which customer groups generate attractive shipment density, pricing and repeat demand after the full cost of serving them is considered.
Consumer expectations are becoming part of the market
Delivery has increasingly become part of the buying experience. IPC’s market research tracks features such as shipment tracking, delivery locations, out-of-home delivery, returns and satisfaction with delivery providers. That matters because consumers are comparing delivery options as part of the purchase decision, while retailers increasingly have to protect the customer experience after checkout.
The commercial effect varies by segment. A consumer buying a low-value product may accept standard delivery if it is inexpensive. A business shipping replacement components may pay more for reliability and predictable delivery windows. A cross-border customer may value customs visibility almost as much as transit speed.
That creates several different willingness-to-pay pools within the same courier market.
What Nexdigm would look for in the demand base
A useful assessment should reconstruct the market from shipment behaviour rather than simply applying a growth rate to the current parcel base. Nexdigm’s analysis can combine customer segmentation, shipment data, corridor economics and competitive pricing to identify where volume growth is likely to translate into attractive commercial opportunities.
Five questions help separate headline growth from usable demand:
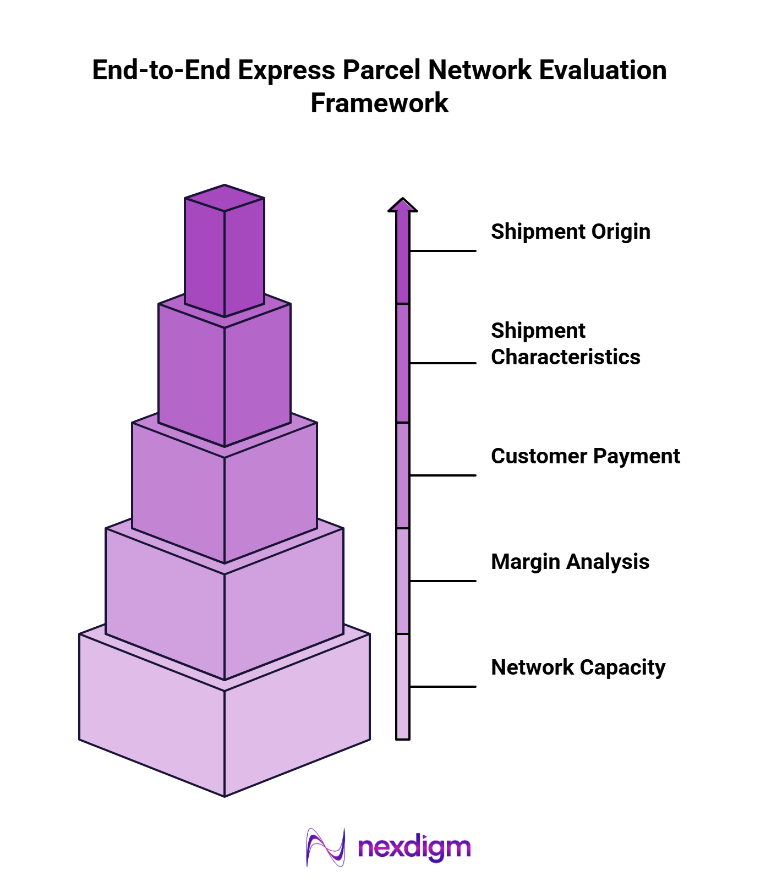
- Who is generating the shipment? Separate marketplaces, large enterprises, SMEs, C2C, direct-to-consumer brands and cross-border sellers.
- What does the shipment look like? Examine frequency, weight, dimensions, declared value, destination, return probability and delivery window.
- What does the customer actually pay for? Test sensitivity to price, speed, tracking, delivery flexibility and reliability rather than assuming every customer values the same service.
- Where does the margin sit? Compare revenue and fulfilment costs across customer segments, shipment types and geographic corridors.
- Can the network support the target mix? A promising segment is less attractive if it requires disproportionate sorting, line-haul or last-mile capacity.
The resulting opportunity map should show where demand is growing, which customers are worth acquiring and what network changes would be required to serve them profitably.
Nexdigm Case: Finding the Higher-Value Parcel Segments
A courier market assessment segmented 1.6 million monthly shipments across six customer groups, combining shipment frequency, geography, pricing and fulfilment costs. SME and cross-border accounts represented 28% of volume but 41% of estimated gross contribution, leading to a targeted network expansion across four priority corridors rather than a volume-led expansion across the full market.
To take the next step, simply visit our Request a Consultation page and share your requirements with us.
Harsh Mittal
+91-8422857704