

Vehicles increasingly cross borders not only as finished products but as indicators of how manufacturers are positioning production, pricing, and market strategies. Global vehicle production reached 96.4 million units in 2025, up 3.9% from 2024, while global vehicle sales reached nearly 99.8 million units. Asia accounted for more than 61% of global production, with India producing 6.49 million vehicles and Japan producing 8.41 million.
At the market level, 2025 vehicle sales exceeded 16.6 million units in the US, 5.5 million in India, 4.6 million in Japan, and 3.2 million in Germany. These differences between production and demand create complex export-import relationships. Cross-border vehicle trade intelligence can help businesses understand where vehicles are being produced, where demand is emerging, how pricing differs, and how competitors are expanding across markets.
Production Hubs and Demand Centers Are Not Always the Same
A vehicle may be manufactured in one country, exported through another regional hub, and sold in a third market. This makes cross-border trade patterns useful for understanding manufacturing footprints and market strategies. Export growth can indicate rising production competitiveness, while import growth can signal demand that local manufacturing cannot fully meet. Comparing these movements can reveal changing relationships between production hubs and destination markets.
The Growing Importance of Trade Data
Trade data becomes more commercially useful when export and import movements are examined alongside pricing, product mix, and competitive participation.
- Export Market Shifts: Rising vehicle exports from a country can indicate increasing production competitiveness, new market entry, or manufacturers expanding their international footprint.
- Import Demand Signals: Increasing imports can reveal markets where consumer demand is growing faster than domestic production or where specific vehicle segments remain supply-dependent.
These signals provide a starting point for understanding where vehicles are moving, why trade relationships are changing, and which markets may offer commercial opportunities.
How Experts at Nexdigm Connect Vehicle Trade Signals
Vehicle trade data becomes strategically useful when individual movements are connected to the companies, markets, and demand conditions behind them. Nexdigm brings these dimensions together to help businesses interpret cross-border vehicle activity through:
- Connecting Trade with Market Dynamics: Compare exports and imports with vehicle demand, production, pricing, and segment trends to understand what is driving cross-border movements.
- Revealing Competitive Opportunities: Map manufacturers, exporters, importers, destinations, and trade growth to identify market gaps, emerging competitors, and potential expansion opportunities.
By connecting these signals, Nexdigm helps businesses move from tracking vehicle movements to understanding where trade relationships are changing and where commercial opportunities may emerge.
Nexdigm’s Cross-Border Vehicle Trade Intelligence
Nexdigm examines vehicle trade across several connected dimensions through Cross-Border Vehicle Trade Intelligence to understand the drivers behind changing export markets, import demand, pricing, and competition. These drivers are:
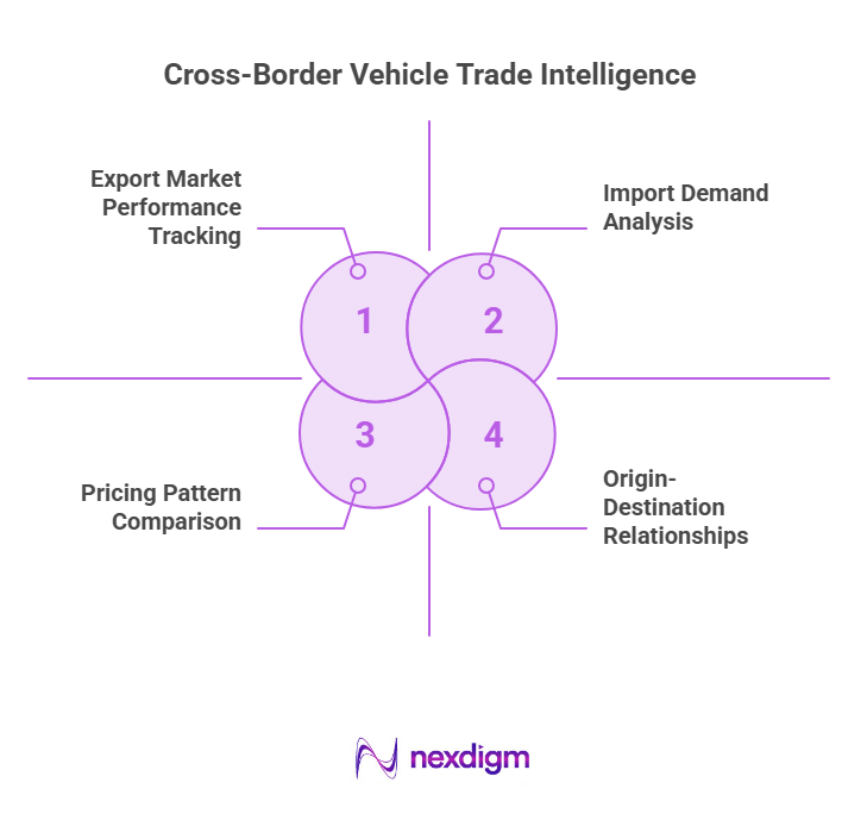
- Export Market Performance: Track export volumes, destination markets, vehicle categories, and growth rates to identify markets gaining importance.
- Import Demand: Analyze import values, volumes, vehicle segments, and sourcing countries to identify demand centers and supply dependencies.
- Pricing Patterns: Compare trade values across products and destinations to identify pricing differences and changes in market positioning.
- Origin-Destination Relationships: Examine trade corridors and changing market relationships to identify emerging routes, sourcing shifts, and market opportunities.
These focus areas help convert fragmented trade records into a market-to-market view of vehicle movements and competitive dynamics.
How Nexdigm’s Trade Intelligence Approach Is Different
Cross-border vehicle trade can be measured through shipment volumes and trade values, but these figures alone do not explain the commercial opportunity. Nexdigm connects trade movements with the market and competitive factors behind them to help businesses understand:
- Market-to-Market Perspective: Nexdigm compares origin and destination markets to understand differences in demand, production, pricing, and competitive intensity.
- Product-Level Intelligence: Vehicle categories and trade values are examined together to identify which segments are driving growth and where demand is changing.
- Competitive Context: Trade movements are linked with manufacturers, exporters, importers, and market participation to reveal changing competitive positions.
- Forward-Looking Interpretation: Historical trade patterns are combined with market and production signals to distinguish temporary movements from potentially sustainable opportunities.
This integrated approach helps businesses move beyond tracking where vehicles are traded to understanding what drives those flows and how they can inform market, export, and competitive decisions.
Nexdigm’s Cross-Border Vehicle Trade Intelligence Case
Nexdigm assessed vehicle trade across 13 markets and 11 vehicle categories, identifying 18% growth across selected export corridors and three destination markets with more than 20% import growth. The analysis highlighted seven priority export markets and five competitive gaps, helping the client refine its international expansion and export-market strategy.
To take the next step, simply visit our Request a Consultation page and share your requirements with us.
Harsh Mittal
+91-8422857704