
Digital commerce now influences over USD 6 trillion in global consumer spending. Yet nearly 70% of retailers still rely on outdated or incomplete KPIs, masking performance gaps that directly impact growth.
In a world where customer expectations shift by the minute, measuring only sales is no longer enough. Retailers must evaluate conversion health, fulfillment efficiency, digital engagement, and profitability to understand how well their digital engine is truly performing.
This is where Digital Retail Performance Analysis becomes a competitive differentiator, helping retailers benchmark against global leaders and uncover the hidden drivers of sustainable digital growth.
Challenges Retailers Face If They Don’t Use Digital Retail Performance Analysis
- Hidden Revenue Leakages Go Unnoticed: Without tracking key metrics like conversion rate or cart abandonment, retailers miss out on diagnosing the 70%+ cart abandonment problem that plagues global e-commerce.
- Inefficient Omnichannel Operations: Retailers who fail to benchmark fulfillment metrics often operate with delivery delays of 20–40% longer than industry leaders.
- Marketing Spend Becomes Less Effective: Without digital engagement KPIs, brands overspend on acquisition but underinvest in retention, despite the fact that acquiring a new customer costs 5–7x more than retaining one.
- Poor Store-Level Productivity Decisions: Retailers who ignore store-level sales KPIs like sales per square foot or revenue per store often experience productivity gaps of 25–30% between their best and worst-performing outlets.
Key Metrics in Digital Retail Performance Analysis
The following are the most critical metrics every retailer must evaluate:
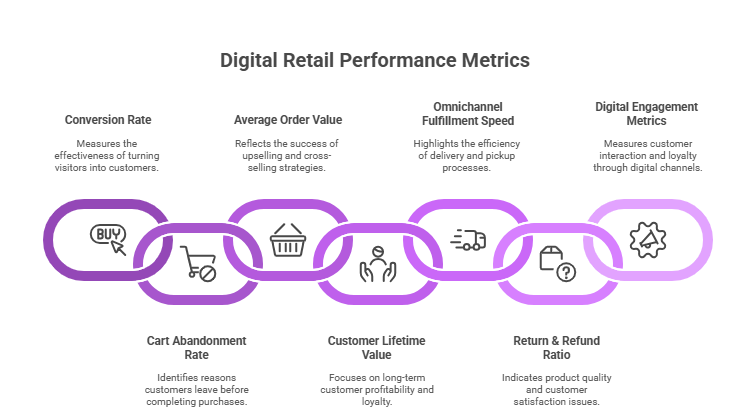
- Conversion Rate: This metric shows how effectively online visitors are becoming paying customers. A strong conversion rate signals a smooth digital experience, while a weak one highlights issues in product presentation, pricing, or checkout processes.
- Cart Abandonment Rate: Monitoring abandonment helps identify pain points in the purchase journey. Unexpected costs, slow loading times, or limited payment options often cause customers to drop off before completing a transaction.
- Average Order Value (AOV): AOV reflects the efficiency of upselling and cross-selling strategies. Retailers use this metric to design bundles, loyalty discounts, or personalized offers that increase revenue per transaction.
- Customer Lifetime Value (CLV): CLV goes beyond one-time sales to measure long-term customer profitability. By analyzing it, retailers can shift focus toward nurturing loyal, repeat customers who sustain revenue growth.
- Omnichannel Fulfillment Speed: As online and offline channels blend, the speed of delivery or in-store pickup is a defining factor in customer satisfaction. This metric highlights where logistics can be streamlined for faster service.
- Return & Refund Ratio: High return levels often indicate quality mismatches, misleading descriptions, or poor fit. Tracking this metric helps reduce hidden costs while building customer trust through reliable experiences.
- Digital Engagement Metrics: Indicators like click-through rates, app activity, and loyalty program participation measure how connected customers are to a brand. Strong engagement usually leads to higher retention and repeat purchases.
Together, these metrics provide retailers with a comprehensive lens to evaluate digital performance. When benchmarked against industry leaders, they uncover both strengths to build on and weaknesses to address, ensuring that performance improvements are data-driven, not assumption-based.
Nexdigm Case
A leading retail chain approached Nexdigm after noticing inconsistent digital conversion rates across regions. Through a structured benchmarking study covering 20+ KPIs, Nexdigm uncovered gaps in checkout UX, pricing alignment, and fulfillment speed.
Within six months, the retailer achieved:
- 16% improvement in digital conversion
- 24% faster fulfillment cycles
- 14% increase in repeat purchases driven by optimized engagement strategies
To take the next step, simply visit our Request a Consultation page and share your requirements with us.
Harsh Mittal
+91 96549 82241