
The EdTech race isn’t slowing down; it’s accelerating.
With over 1.5 billion learners globally accessing digital education, institutions and platforms can’t rely on intuition anymore. They must know who is winning, why they’re winning, and what gaps they must close to stay relevant.
Benchmarking is the difference between scalable growth and stagnation.
Challenges EdTech Platforms Face Today
- Engagement Drops Even as Enrollments Surge: Global EdTech users crossed 1.5 billion, but average course completion still sits below 20%.
- Customer Acquisition Costs Are Rising Uncontrollably: Digital ad costs have increased by 35% globally in three years, pushing EdTech CAC to all-time highs.
- Tech Stack Inefficiencies Cause High Burn Rates: Cloud, AI, and security infrastructure costs for EdTech platforms have risen by 18–22% annually.
- Localization Gaps Derail Expansion Efforts: Nearly 65% of EdTech cross-border rollouts fail due to insufficient localization of content, pricing, or pedagogy.
Nexdigm’s EdTech Platform Benchmarking
Nexdigm evaluates EdTech platforms using deep-dive competitive intelligence, technology assessments, global adoption analysis, and business model evaluations.
To ensure leaders get an accurate, actionable picture, our benchmarking framework spans seven core areas:
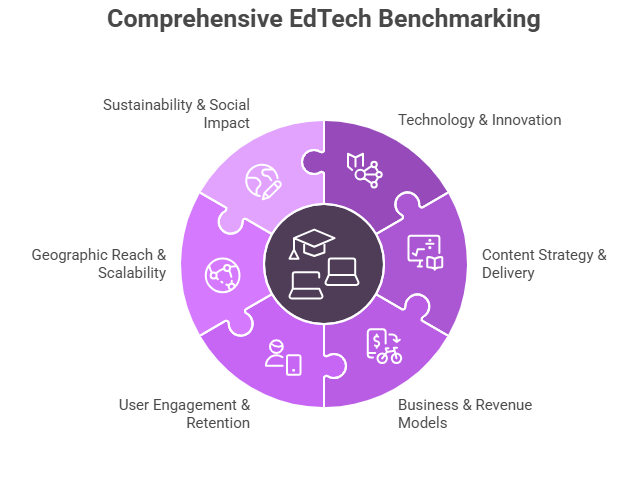
Technology & Innovation Benchmarking
Over 60% of high-growth EdTech platforms globally now use AI-based adaptive learning models.
We compare how platforms deploy:
- AI-driven personalization tools
- Adaptive learning engines
- AR/VR immersive models
- Gamified learning experiences
Content Strategy & Delivery Benchmarking
More than 70% of APAC learners prefer bite-sized microlearning modules for skill development.
We examine:
- Curriculum alignment across geographies
- Localized content strategies
- Microlearning formats
- Hybrid and blended learning models
Business & Revenue Model Benchmarking
Subscription-driven EdTech models grew by over USD 20 billion in new recurring revenue in the past three years.
We evaluate:
- Subscription vs. freemium models
- Institutional licensing strategies
- Corporate learning partnerships
- Digital credentialing ecosystems
User Engagement & Retention Metrics
Platforms with community-based learning features report up to 40% higher course completion rates.
We benchmark:
- Daily Active Users (DAU)
- Completion rates
- Sticky features (quizzes, streaks, community learning)
- Learning outcome effectiveness
Geographic Reach & Scalability
Over 65% of EdTech expansion failures stem from weak localization strategies.
We map:
- Multi-country expansion
- Regulatory readiness
- Localization maturity
- Partner ecosystems with schools, colleges & governments
Sustainability & Social Impact Benchmarking
Nearly 250 million students worldwide lack access to traditional schooling, heightening demand for inclusive EdTech models.
We evaluate:
- Affordability models
- Accessibility features (multilingual, mobile-first, disability-friendly)
- Inclusion-focused initiatives
How Businesses Benefit from Nexdigm’s Benchmarking Framework
- EdTech Companies: Gain insights to refine product roadmaps, improve engagement, and unlock new revenue streams.
- Investors: Identify scalable players with strong ROI, reducing investment risk in crowded markets.
- Educational Institutions: Benchmark platforms on outcomes, affordability, and inclusivity to choose the right partners.
- Policymakers: Understand adoption trends for national-level digital-learning initiatives.
Nexdigm Case
A leading digital skilling platform partnering across Asia struggled with low completion rates and unclear learner engagement patterns. Nexdigm benchmarked 14 global competitors, mapped engagement triggers, and redesigned the retention model. The result: a 34% jump in course completion, and a 19% increase in paid conversions within five months.
To take the next step, simply visit our Request a Consultation page and share your requirements with us.
Harsh Mittal
+91-8422857704