

Industrial and commercial customers do not buy energy on price alone. They buy an input to production, service delivery and business continuity. A manufacturer facing costly line stoppages may pay for dependable power. A retailer with hundreds of sites may place more weight on predictable bills and consistent service. A data centre may prioritize access to firm capacity, while a facility with controllable processes may value the option to shift consumption.
Demand is growing, but customer needs are not uniform. The International Energy Agency expects global electricity demand to grow by an average of 3.6% annually from 2026 to 2030, adding about 1,100 terawatt-hours per year. In the United States, the 2025 average retail price was 13.41 cents per kilowatt-hour for commercial customers and 8.62 cents for industrial customers. These national averages give context, but a customer’s actual bill depends on location, tariff, contract and load profile.
A useful energy sector customer demand analysis separates four dimensions:
- Cost: The full bill, including energy, demand charges, time-of-use rates, fuel adjustments and contract risk. Predictability can matter as much as the lowest expected price.
- Reliability: The operational and financial consequences of interruptions, voltage fluctuations, delayed restoration or insufficient capacity.
- Flexibility: The ability to adjust consumption, use storage, add capacity or respond to demand signals without harming operations.
- Security: Confidence in physical supply, fuel availability, cyber protection and resilience to market disruption.
These dimensions overlap, but they are not interchangeable. Backup generation can improve continuity while adding fuel and maintenance exposure. A flexible tariff may reduce costs but require operational changes. A fixed-price contract can make budgeting easier without guaranteeing uninterrupted supply. Customers need to know which risk an offer addresses and what it leaves unresolved.
Understand the Operation Behind the Purchase
Customer research should start with how each facility operates. Interviews with procurement, finance, facilities and plant teams can surface different views of what matters. Bill and interval-meter analysis then tests those views against actual consumption, peak demand and tariff exposure. Outage records and production schedules help estimate the business impact of interruptions.
This evidence often reveals differences that broad sector labels conceal. Two manufacturers may use similar amounts of electricity but have very different tolerance for outages. One can reschedule production; another may lose product or require a lengthy restart. A commercial property may shift some cooling demand, while a cold-storage facility may have fewer safe hours to reduce consumption.
Flexibility is increasingly relevant as power systems manage higher peaks and changing generation patterns. The IEA identifies demand response as a tool for businesses to shift or reduce usage when the grid or market needs it. Its value to a customer depends on operational limits, tariff design and whether incentives compensate for the effort and risk of participation. A theoretical load reduction is not a useful product proposition if the customer cannot deliver it consistently.
Location also shapes what buyers value. In 2025, average U.S. retail electricity prices across customer classes ranged from 8.20 cents per kilowatt-hour in North Dakota to 35.72 cents in Hawaii. Differences in generation, fuel and regulation affect the economics of offers. For a multi-site buyer, regional contracting and consistent budget controls may matter more than a single national price.
Framework: Match the Offer to the Customer’s Value Equation
Nexdigm can use this four-step framework to identify priority segments and test which products fit their needs.
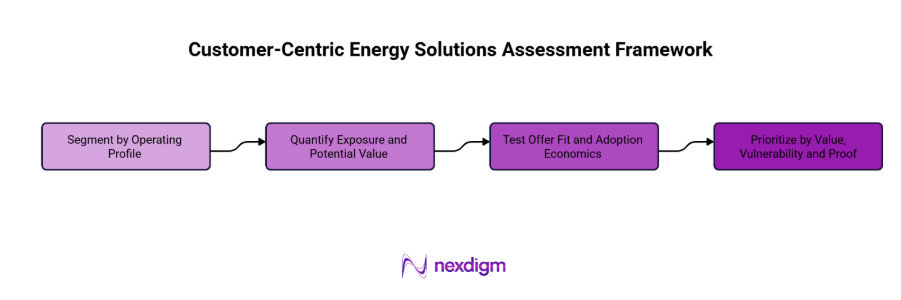
- Segment by Operating Profile
Group customers by load shape, operating hours, process criticality, site type and ability to shift consumption. Use actual site data where available. Avoid treating all customers in one industry as equivalent. - Quantify Exposure and Potential Value
Estimate bill exposure using tariffs and interval loads. Assess the cost of interruption using outage history and operating consequences. Identify flexible loads, storage options and capacity constraints. Keep measurable benefits separate from customer preferences that have not yet been validated. - Test Offer Fit and Adoption Economics
Match potential products to the needs identified: price certainty, resilience, flexibility or a combination. Compare the expected benefit with the price, operating changes and service obligations. Check that the teams receiving the benefit are involved in the purchasing decision. - Prioritize by Value, Vulnerability and Proof
Rank segments by potential financial or operational value, exposure to energy-related risks, and whether available data can verify the benefit. Pilot offers where the economics look promising but evidence is incomplete. Track uptake, customer savings and service performance before scaling.
Nexdigm Case Study
Nexdigm modelled 120 manufacturing and commercial sites across Gujarat and Maharashtra using load profiles, tariff bills, outage exposure and buyer interviews. The scenario found 31% could shift at least 8% of peak load, while 24% had resilience needs worth assessing. We recommended segment-specific fixed-price and flexibility offers, tracked against site-level savings.
To take the next step, simply visit our Request a Consultation page and share your requirements with us.
Harsh Mittal
+91-8422857704