

Food and beverage procurement becomes difficult to benchmark when spending is distributed across plants, warehouses, restaurants, and regional buying teams. Each location may negotiate separately, use different suppliers, or record freight and rebates differently. The resulting data can make an inefficient purchasing model appear competitive simply because no consistent comparison exists.
A meaningful assessment connects three measures: the price paid, the performance delivered by suppliers, and the efficiency of the sourcing process.
Market Conditions: Why Category Benchmarks Matter
India’s food-processing sector generated gross value added of ₹2.24 lakh crore in 2023-24, compared with ₹1.34 lakh crore in 2014-15, according to government estimates. The sector recorded an average annual growth rate of 6.55% over the nine years ending in 2023-24. Processed food’s share of agricultural exports rose from 13.7% in 2014-15 to 20.4% in 2024-25.
These developments indicate a growing processing and supplier ecosystem. They do not, however, establish that buyers automatically receive better prices. New capacity may be concentrated in particular products or locations, and technical specifications can limit the number of suppliers that are genuinely interchangeable.
International commodity movements add another layer. The FAO Food Price Index reached 136.0 points in September 2026, up 5.8% year on year. Cereals were 17.2% higher than a year earlier and vegetable oils 18.3% higher, while dairy was 18.8% lower. These global indicators are useful context, not direct benchmarks for Indian contract prices.
Spend Benchmarking: Where Is the Money Going?
The first task is to establish a consistent baseline across ingredients, packaging, contract manufacturing, logistics, equipment, and operating supplies.
A useful spend review identifies:
- Category concentration: The products and categories accounting for the largest share of annual expenditure.
- Supplier concentration: The proportion of category spend committed to the largest vendors.
- Price variation: Differences between sites buying equivalent products under comparable terms.
- Purchasing leakage: Spend outside negotiated contracts, missed rebates, and emergency purchases.
- Cost allocation gaps: Freight, storage, testing, and other charges recorded separately from product costs.
The baseline should be adjusted for volume, product mix, and specification. Otherwise, an apparent price increase may simply reflect greater purchases of premium products or smaller delivery quantities.
Vendor Benchmarking: Which Suppliers Deliver Better Value?
Vendor comparison should include price, quality, service, and continuity. A lower-priced ingredient can create additional costs through poor yield or rejected batches. A packaging vendor with a longer lead time may require larger safety stocks. A distributor with a higher price may offer more frequent deliveries and lower inventory requirements.
Supplier assessments should therefore compare equivalent products and measure:
- Delivered price and commercial charges.
- On-time delivery and order fill rates.
- Quality consistency, defects, and rejection rates.
- Capacity, geographic coverage, and responsiveness.
- Backup supply options and qualification lead times.
For F&B procurement benchmarking services, supplier scorecards should use category-specific measures rather than applying the same weightings to fresh produce, packaging, and specialised ingredients.
Sourcing Efficiency: Is the Buying Process Creating Extra Cost?
A competitive supplier rate can still be undermined by an inefficient purchasing model. Fragmented orders may increase freight, multiple product specifications may reduce volume leverage, and manual purchasing processes can make it difficult to enforce agreed contracts.
Efficiency analysis should examine supplier counts, order frequency, purchase-order compliance, approval time, forecast accuracy, and the frequency of urgent replenishment. Consolidation is not always the answer: perishable goods and geographically dispersed operations may require regional suppliers.
F&B Procurement Benchmarking Framework
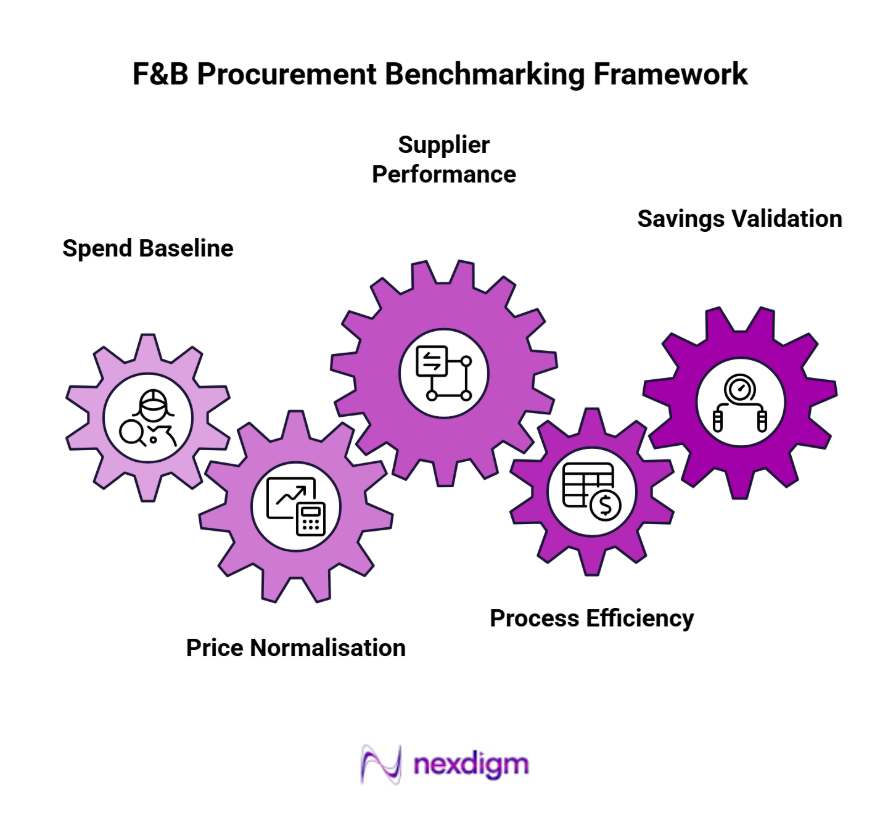
- Spend Baseline: Consolidate spend by category, site, supplier, and period using consistent product codes and units.
- Price Normalisation: Compare equivalent specifications, delivered quantities, freight, rebates, and payment terms.
- Supplier Performance: Assess quality, delivery reliability, capacity, responsiveness, and continuity alongside cost.
- Process Efficiency: Identify fragmented ordering, contract leakage, unnecessary supplier variation, and avoidable emergency purchases.
- Savings Validation: Prioritise commercially achievable changes and track results against a volume- and mix-adjusted baseline.
Outlook: Procurement Needs a Continuous Benchmark
As the food-processing ecosystem expands, procurement teams may gain access to more suppliers, but the commercial advantage depends on qualifying alternatives and maintaining reliable data. Quarterly or event-driven reviews can identify when market movements, supplier performance, or contract conditions justify action.
Nexdigm’s Case Study
A food manufacturer consolidated ₹45 crore in annual purchasing across five sites. The review identified inconsistent pricing for comparable materials, fragmented ordering, and purchases outside agreed contracts. Category negotiations and purchasing controls established a targeted savings programme, with results tracked against actual invoices and adjusted purchasing volumes.
To take the next step, simply visit our Request a Consultation page and share your requirements with us.
Harsh Mittal
+91-8422857704