

India’s fertilizer market is large enough for headline consumption numbers to conceal what is happening underneath. Annual mineral fertilizer consumption exceeds 60 million metric tonnes of physical product, but volume growth can come from very different sources: more cultivated area, greater cropping intensity, changing crop patterns, nutrient depletion or policy-driven price distortions.
For manufacturers and distributors, separating these effects matters because some drivers create durable demand while others produce temporary volume movements.
Start With the Acre, Not the Bag
India’s gross cropped area has reached approximately 219.36 million hectares, while cropping intensity stands at around 155.9%. More cultivated acreage naturally expands the fertilizer requirement, but the crop occupying that acreage determines how much and which nutrients are needed.
The shift toward commercial maize, mustard, vegetables, oilseeds and other higher-value crops can alter fertilizer demand even without a corresponding increase in total cultivated land.
Mustard, for example, has specific nitrogen and sulfur requirements associated with oil production. Vegetable cultivation can require substantially more intensive nutrient management than traditional cereal systems.
Consequently, a district gaining acreage in nutrient-intensive crops can generate stronger fertilizer demand than one experiencing similar overall agricultural growth.
Cropping Intensity Creates a Second Demand Layer
The same hectare can generate fertilizer demand multiple times a year.
India has approximately 122.29 million hectares of gross irrigated area, equivalent to around 55.75% of gross cropped acreage. Tubewells account for a significant share of irrigated land, enabling farmers to move from single-season cultivation toward double- or triple-cropping systems.
This changes the annual nutrient requirement attached to a physical hectare. Where irrigation supports multiple harvests, fertilizer demand becomes linked to the number and composition of crop cycles rather than land area alone.
For manufacturers, identifying districts with rising irrigation intensity can therefore reveal demand pockets that a conventional acreage forecast would miss.
Nutrient Imbalance Is Creating a Different Kind of Opportunity
Controlled retail pricing for urea alongside the Nutrient Based Subsidy (NBS) framework for P and K fertilizers has skewed relative prices, driving persistent N:P:K imbalances in intensive cereal belts.
This dynamic shapes the market in two ways:
- Diminishing returns on nitrogen: Over-application of urea yields negligible additional output.
- Specialty input demand: Widespread depletion of secondary and micronutrients, particularly zinc and sulfur, is shifting demand toward fortified fertilizers, custom NPK blends, micronutrients, and water-soluble formulations.
Farm Economics Determines Whether Agronomic Need Becomes Demand
A nutrient deficiency does not automatically become a commercial sale.
Farmers need sufficient cash flow to purchase inputs during narrow sowing windows. Crop prices, procurement arrangements, access to agricultural credit and expected farm margins therefore influence actual fertilizer absorption.
Commercial crops such as sugarcane and potato can support larger upfront input purchases where farm economics are favourable. Farmers growing lower-margin crops may respond more cautiously to higher-priced specialty products even when agronomic benefits are clear.
The distinction between agronomic requirement and purchasing capacity is particularly important when estimating premium fertilizer markets.
The Demand Mix Is Becoming More Segmented
Fertilizer companies increasingly need to look beyond aggregate tonnes. Four demand pools can develop simultaneously:
- Conventional nutrient demand linked to cultivated acreage.
- Incremental demand generated by higher cropping intensity.
- Replacement demand created by soil nutrient depletion.
- Premium demand for specialised, fortified and precision-applied products.
These pools have different growth rates, pricing characteristics and levels of resilience.
A company expanding a standard fertilizer portfolio may therefore find that the highest-value opportunity lies in a smaller specialty segment rather than in the largest-volume market.
Building a Driver-Based Demand Model
A fertilizer market demand assessment can separate these effects at district and crop level. Nexdigm can evaluate:
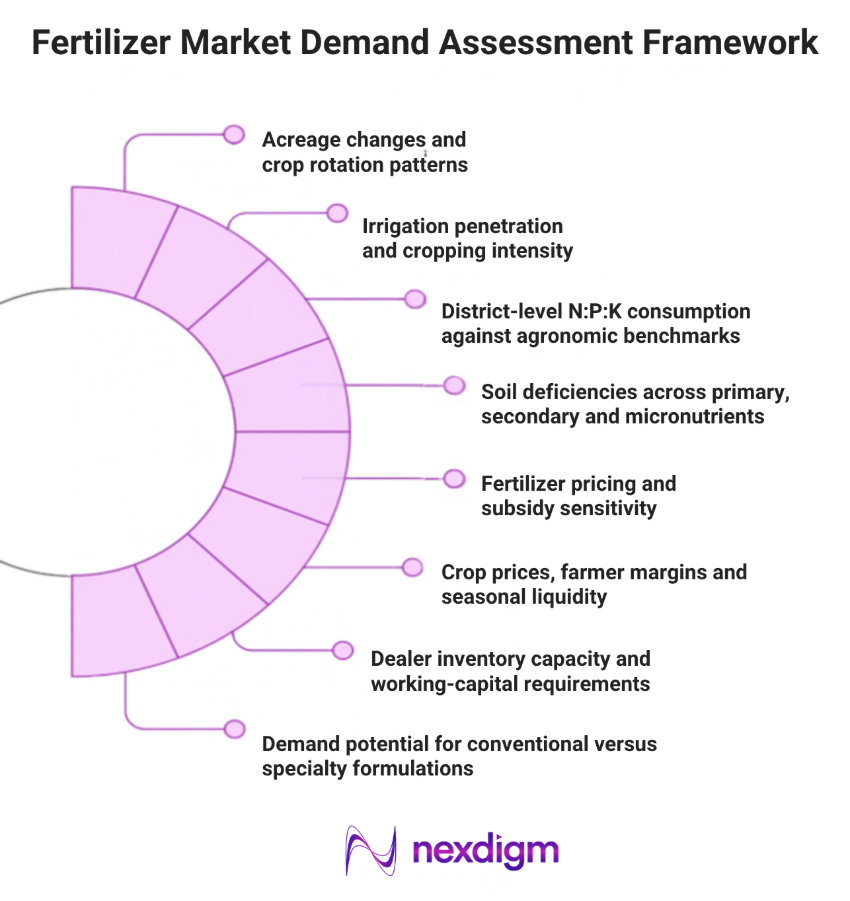
- Acreage changes and crop-rotation patterns: Track shifts in cultivated area, cropping patterns and rotations to estimate how changes in crop mix could alter fertilizer consumption.
- Irrigation penetration and cropping intensity: Assess irrigation coverage and multiple-cropping patterns to identify regions where more planting cycles could increase annual nutrient requirements.
- District-level N:P: K consumption against agronomic benchmarks: Compare actual nutrient application ratios with recommended levels to identify overuse, under-application and potential demand for balanced formulations.
- Soil deficiencies across primary, secondary and micronutrients: Map deficiencies in nitrogen, phosphorus, potassium, zinc, sulphur, boron and other nutrients to identify opportunities for specialised fertilizer products.
- Fertilizer pricing and subsidy sensitivity: Evaluate how changes in fertilizer prices, subsidy structures and input affordability could affect farmer purchasing behaviour and product-level demand.
- Crop prices, farmer margins and seasonal liquidity: Link fertilizer affordability to crop realisations, farm profitability, credit access and the timing of farmer cash flows.
- Dealer inventory capacity and working-capital requirements: Assess distributor and retailer capacity to stock fertilizers before peak seasons, including credit cycles, inventory turnover and working-capital constraints.
- Demand potential for conventional versus specialty formulations: Estimate where standard fertilizers can sustain volume growth and where soil conditions, crop economics and precision application could support higher-value specialty products.
This approach allows manufacturers to distinguish volume growth from portfolio-mix opportunities and determine where additional distribution capacity or product investment is justified.
Case Study: Converting Soil Gaps into Portfolio Growth
A fertilizer manufacturer assessed 12 districts with combined annual fertilizer consumption of 4.6 million tonnes. District-level soil and sales analysis showed that zinc and sulfur deficiencies were concentrated across 2.8 million cultivated acres, while specialty fertilizer penetration remained below 9%. A portfolio of fortified NPK products priced at an average INR 1,850 per acre was estimated to address 420,000 acres within three years. At 60% adoption of the targeted acreage, the model projected INR 46.6 crore in annual incremental revenue and a 17% improvement in product-level gross margin.
To take the next step, simply visit our Request a Consultation page and share your requirements with us.
Harsh Mittal
+91-8422857704