
Historical sales are the natural starting point for an FMCG forecast, but they are rarely sufficient on their own. A category can show strong value growth because of price increases, while underlying volumes remain weak. A temporary promotion can inflate a quarter. Distribution expansion can create a one-time jump. A shift toward smaller packs can increase unit sales without producing equivalent volume growth.
The forecasting challenge is therefore to distinguish the factors that created yesterday’s sales from the factors that are likely to shape tomorrow’s demand.
The Current Market Is Already Showing Divergence
India’s FMCG market recorded 12.9% value growth and 5.4% volume growth in Q3 2025, with prices rising 7.1%. NIQ also reported that unit growth exceeded overall volume growth, indicating a stronger consumer preference for smaller packs.
By Q4 2025, FMCG value growth had moderated to 7.8%. E-commerce accounted for 18% of FMCG sales in the top eight metros, while small manufacturers continued to outpace larger players in volume growth.
The latest Q2 2026 snapshot shows e-commerce reaching 7% of FMCG sales nationally, with modern trade and e-commerce driving incremental growth while rural and urban markets continue to diverge.
These shifts make a single historical growth rate increasingly unreliable.
What Should Actually Change the Forecast?
A robust forecast separates demand into identifiable drivers.
- Base consumption: What underlying consumption would look like without unusual promotions or supply disruptions?
- Price: How much of historical value growth came from price rather than additional consumption?
- Distribution: Will additional outlets, regions or channels expand the addressable consumer base?
- Pack architecture: Are consumers moving toward ₹5 and ₹10 packs, larger family packs or premium formats?
- Category substitution: Could consumers shift between brands, formats or adjacent categories?
- Channel migration: What happens when purchases move from traditional trade to modern trade, e-commerce or quick commerce?
- Macro conditions: How could inflation, disposable income, commodity costs or regulatory changes affect purchasing?
Each variable should be separated before the forecast is built.
Forecasting Volume and Value Separately
One of the most common sources of distorted FMCG forecasts is treating value growth as equivalent to demand growth.
NIQ’s Q3 2025 data demonstrates why the distinction matters: 12.9% value growth consisted of 5.4% volume growth alongside 7.1% price growth.
A category growing 10% in value may therefore have a very different commercial outlook depending on whether it is driven by:
- 8% volume and 2% price
- 3% volume and 7% price
- 0% volume and 10% price
The first suggests expanding consumption. The third may indicate that nominal growth is masking stagnation.
Forecasting should consequently produce separate volume, price and value trajectories.
Channel and Geography Need Their Own Forecast Curves
India’s FMCG market is increasingly uneven.
NIQ’s Q1 2026 assessment describes a transition from broad-based expansion toward more selective, channel-led growth, with affordability pressure and different rural and urban demand patterns. It also highlights the importance of ₹5 and ₹10 price points.
A national forecast can therefore conceal commercially important differences.
A category may be:
- Growing faster in rural markets
- Declining in metros
- Expanding through modern trade
- Losing traditional-trade penetration
- Gaining incremental demand through e-commerce
- Experiencing premiumization among higher-income consumers
The forecast should reflect these separate trajectories before they are aggregated into a national number.
Building the Forecast Around Leading Indicators
Historical sales remain important, but they should be supplemented with forward-looking indicators.
Consumer purchase frequency can reveal changes before annual sales data does. Distribution additions can indicate future availability. Search behaviour, new product launches, promotional intensity, retailer orders and channel expansion can provide additional evidence of emerging demand.
NIQ’s 2026 pricing analysis also highlights the growing importance of price elasticity, promotion effectiveness and price-pack architecture in India’s cost-conscious FMCG market.
The result is a forecast based on demand mechanics rather than a simple CAGR.
Nexdigm’s FMCG Forecasting Architecture
Nexdigm’s FMCG product demand forecasting services help companies translate historical sales, consumer behaviour, pricing, distribution and competitive signals into more reliable category and product-level forecasts.
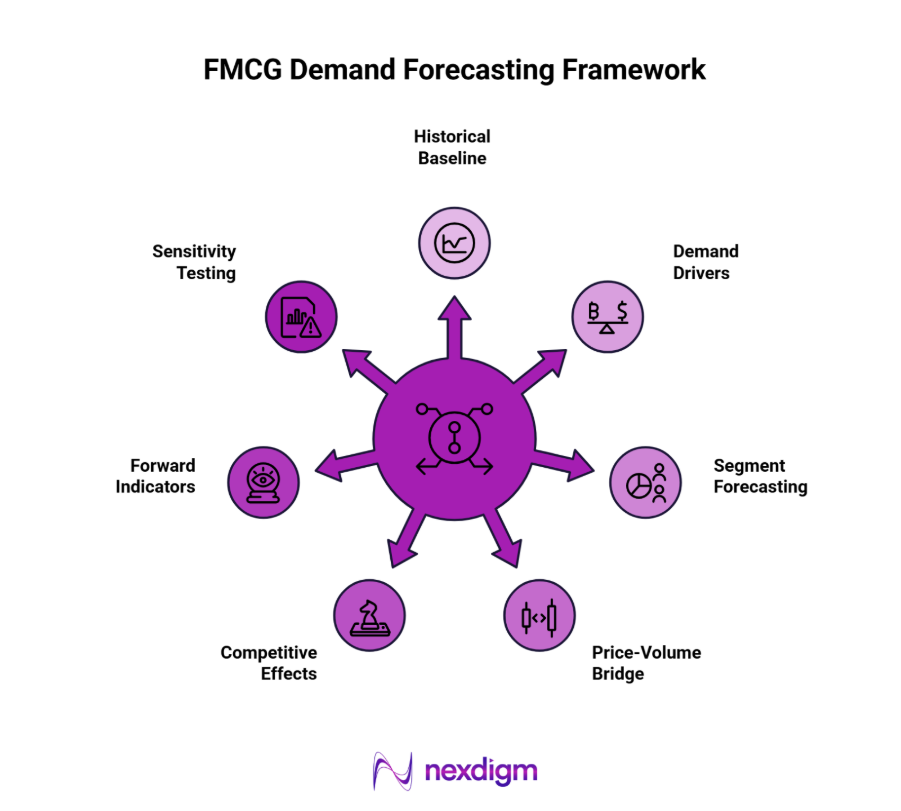
- Historical Baseline: Normalize sales for seasonality, promotions, stock-outs and exceptional events.
- Demand Drivers: Quantify the influence of price, distribution, consumer frequency, income and category substitution.
- Segment Forecasting: Build separate projections by product, geography, consumer segment and channel.
- Price-Volume Bridge: Separate nominal growth from underlying volume expansion.
- Competitive Effects: Account for new launches, market-share movements, promotions and private-label pressure.
- Forward Indicators: Incorporate channel expansion, consumer research and emerging behavioural signals.
- Sensitivity Testing: Stress-test forecasts against alternative assumptions for price, volume, distribution and macroeconomic conditions.
This approach produces a forecast that can be used for capacity planning, portfolio decisions, inventory requirements and market investment rather than simply reporting an expected market CAGR.
Nexdigm Case: Improving FMCG Demand Forecasting Accuracy
An FMCG company reviewed 24 months of sales across 320 SKUs and 6 regions. Nexdigm integrated historical demand, seasonality, pricing and distribution variables, reducing forecast variance by 21% and identifying ₹18 crore in previously underplanned demand.
To take the next step, simply visit our Request a Consultation page and share your requirements with us.
Harsh Mittal
+91-8422857704