

Freight demand is rarely distributed in proportion to the size of an economy. Cargo moves between specific production centres, ports, industrial clusters and consumption markets, creating very different economics across individual routes. A freight market can therefore appear attractive at the national level while offering limited opportunity on the corridors where incumbent capacity is already strong.
Global trade patterns are making this distinction more important. Maritime transport carries around 80% of international goods trade by volume, while UNCTAD’s 2025 analysis found that global maritime trade grew 2.2% in 2024 but was expected to expand by only 0.5% in 2025. At the same time, rerouting caused by geopolitical disruption increased maritime ton-miles by 5.9% in 2024, almost three times the growth in physical trade volumes. Longer routes can therefore generate additional freight demand even without equivalent growth in cargo tonnage.
For freight operators, this changes the assessment from a simple volume exercise to a network question. The relevant opportunity may sit in a corridor experiencing rising transport distances, fragmented capacity or growing demand for multimodal services.
Cargo volume only becomes meaningful when its movement is understood
The same volume of freight can produce very different commercial opportunities depending on what is being transported. Bulk commodities tend to move in large consignments through specialised networks. Manufactured goods generate more containerised flows and require greater coordination between factories, distribution centres and ports. Automotive and industrial cargo can require dedicated handling, time-sensitive delivery and specialised equipment.
Cargo concentration is equally important. UNCTAD’s trade and transport datasets are increasingly designed around the relationship between trade flows and transport costs, reflecting the fact that the origin and destination of goods can be as important as the total volume being traded.
A freight assessment should therefore identify where cargo originates, where it is consumed, how frequently it moves and which transport modes are used. A corridor carrying 5 million tonnes of predictable industrial cargo may be more commercially attractive than a market with twice that volume spread across fragmented, low-frequency movements.
Routes are becoming a commercial variable
Geopolitical disruption has also made route design more consequential. UNCTAD reported that the average maritime voyage haul increased from 4,831 miles in 2018 to 5,245 miles in 2024 as shipping routes were altered by security concerns. Alternative corridors have also gained importance. UNCTAD has documented increased use of routes such as the Middle Corridor linking China and Central Asia with Europe, while road and multimodal alternatives have become more relevant when traditional maritime routes face disruption.
For freight providers, route attractiveness therefore depends on more than distance. Border delays, port connectivity, transshipment requirements, empty-backhaul risk and reliability can determine whether a corridor produces sustainable margins.
This is particularly relevant for emerging manufacturing corridors. As supply chains diversify across countries, freight demand can shift toward secondary ports, inland hubs and cross-border routes that previously handled relatively limited volumes.
Customer mix determines the quality of freight demand
Freight customers also purchase different combinations of capacity and service. Large manufacturers may prefer dedicated transport arrangements and predictable transit times. SMEs can place greater value on consolidation, documentation and flexible shipment sizes. Commodity traders may prioritise price and capacity availability, while high-value industrial customers can place greater emphasis on reliability and tracking.
Customer concentration consequently becomes an important risk measure. A corridor dependent on two large shippers may have attractive current volumes but limited resilience if either changes its sourcing model.
The most attractive freight markets often combine several customer groups. This creates a broader base of demand while allowing operators to use the same infrastructure across different shipment patterns.
Turning cargo flows into a commercial decision
A useful freight assessment can be structured around four connected layers:
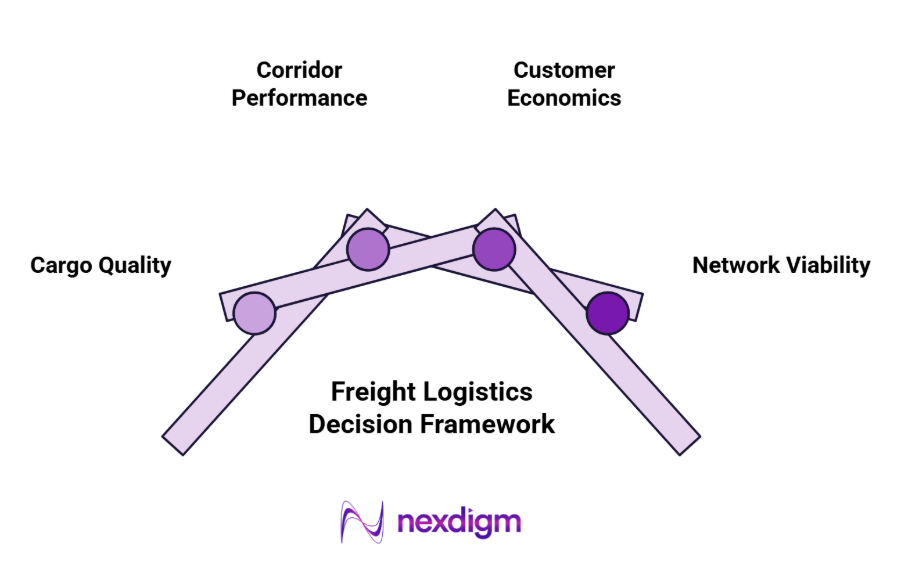
- Cargo quality
Measure tonnes, TEUs, shipment frequency, commodity mix, cargo value and seasonality. The objective is to distinguish recurring commercial demand from temporary or highly concentrated flows. - Corridor performance
Map origin-destination pairs, transport modes, ports, terminals, border crossings and major logistics nodes. Assess transit time, reliability, congestion and backhaul potential rather than relying on nominal distance. - Customer economics
Segment manufacturers, retailers, traders, SMEs and other freight buyers by shipment characteristics and willingness to pay. Identify which customers generate stable volume and which require specialised services. - Network viability
Model line-haul costs, handling, terminal charges, fleet utilisation, empty movements and potential pricing. The final opportunity should be ranked according to both cargo attractiveness and the economics of serving it.
This provides the basis for freight logistics market assessment consulting that connects cargo demand with the practical economics of building or expanding a freight network. For Nexdigm, the resulting assessment can help determine whether the appropriate strategy is dedicated capacity, a multimodal proposition, corridor expansion or partnership with an existing operator.
Illustrative Nexdigm Case: Selecting Priority Freight Corridors
A freight assessment screened 38 industrial corridors across India and Southeast Asia using cargo growth, customer concentration, route reliability and delivered-cost indicators. Seven showed sustained volume growth above 8%. Four supported sufficient density and pricing headroom for dedicated operations, representing an estimated US$72 million annual addressable revenue pool.
To take the next step, simply visit our Request a Consultation page and share your requirements with us.
Harsh Mittal
+91-8422857704