

Freight rates rarely move because of one variable. Capacity availability, fuel costs, trade volumes, congestion, and seasonal demand can all influence what shippers pay, sometimes pushing in opposite directions.
The effect can be seen in current shipping markets. In August 2026, the Drewry World Container Index averaged $4,409 per 40-foot container, while offered capacity was 11.4% higher year on year. Yet port congestion was averaging 1.6 days, and schedule reliability had fallen to 46%. Rates therefore cannot be read simply as a function of available capacity.
For shippers, carriers, and logistics providers, understanding these interactions is more useful than tracking a single freight-rate index.
Capacity Sets the Starting Point
Freight rates respond quickly when available capacity changes relative to cargo demand.
When trucks, vessels, containers, or rail capacity are tight, carriers gain pricing power. When capacity expands faster than demand, competition increases and rates can soften.
Maritime markets demonstrate how this relationship can become complicated. Global container shipping capacity grew 10.1% in 2024, while container demand increased 7.1%. Ordinarily, that gap could have pushed rates down. Instead, Red Sea diversions absorbed much of the additional capacity by forcing ships onto longer routes.
The effective supply available to shippers therefore depends on where capacity is positioned and how efficiently it can be deployed, not simply on the size of the global fleet.
Fuel Creates a Cost Floor
Fuel is one of the clearest variables affecting freight economics, particularly for road transport and shipping.
In India, average truck freight rates from Delhi to major destinations were 7% higher in May 2026 than in February, following diesel price increases of approximately 8.3% during the period. Competitive conditions nevertheless limited the extent to which operators could pass costs directly to customers.
A rise in fuel costs does not necessarily produce an equivalent increase in freight rates. The outcome depends on contract structures, competition, utilisation, and the carrier’s ability to apply fuel surcharges.
For businesses with large freight exposure, fuel sensitivity should therefore be assessed at the lane and contract level.
Trade Flows Can Change the Rate Equation
Freight demand follows the movement of goods. When sourcing locations, export markets, or trade routes change, the demand for transport capacity changes with them.
Geopolitical disruption can amplify the effect. Red Sea rerouting pushed global shipping ton-miles up by around 6% in 2024, nearly three times the growth in trade volume. Longer voyages effectively absorbed vessel capacity while increasing fuel and operating costs.
This is why a corridor can experience rising rates even without exceptional growth in cargo volumes. The same amount of freight may simply require more transport capacity to move it.
Congestion Adds Cost Without Adding Demand
A congested network can create freight inflation even when underlying cargo demand is stable.
Port queues, terminal delays, warehouse bottlenecks, and truck waiting times reduce the productive capacity of the transport system. In August 2026, average containerport waiting time stood at 1.6 days, up 9% month on month.
For shippers, the financial impact extends beyond the quoted freight rate. Delays can create detention and demurrage, additional inventory requirements, missed production schedules, and emergency shipments.
Congestion should therefore be treated as a capacity constraint when analysing freight rates.
Seasonality Can Distort the Market
Freight markets can also experience sharp temporary movements around predictable demand peaks.
In June 2026, the global container index jumped 23% in a single week to $3,433 per 40-foot container, with early peak-season demand driving increases across Asia-Europe and transpacific routes. Shanghai-Los Angeles rates rose 31% that week.
Such movements matter when negotiating contracts or planning capacity, but they should not automatically be interpreted as structural rate growth.
The key is separating recurring seasonal pressure from a lasting change in supply-demand conditions.
Rate Analysis Needs to Look Beyond the Headline Number
A meaningful freight-rate assessment should connect:
- Capacity: available vehicles, vessels, containers, and equipment
- Fuel: diesel, bunker prices, and surcharge mechanisms
- Trade flows: cargo volumes, sourcing shifts, and corridor changes
- Congestion: port, terminal, warehouse, and road delays
- Seasonality: peak periods, harvest cycles, and demand fluctuations
- Utilisation: load factors, empty running, and backhaul availability
The interaction between these variables determines whether a rate movement is temporary, structural, or specific to a particular corridor.
How Nexdigm Separates Freight Rate Drivers
Nexdigm’s freight rate market analysis evaluates the underlying economics of freight movements rather than relying on headline market averages.
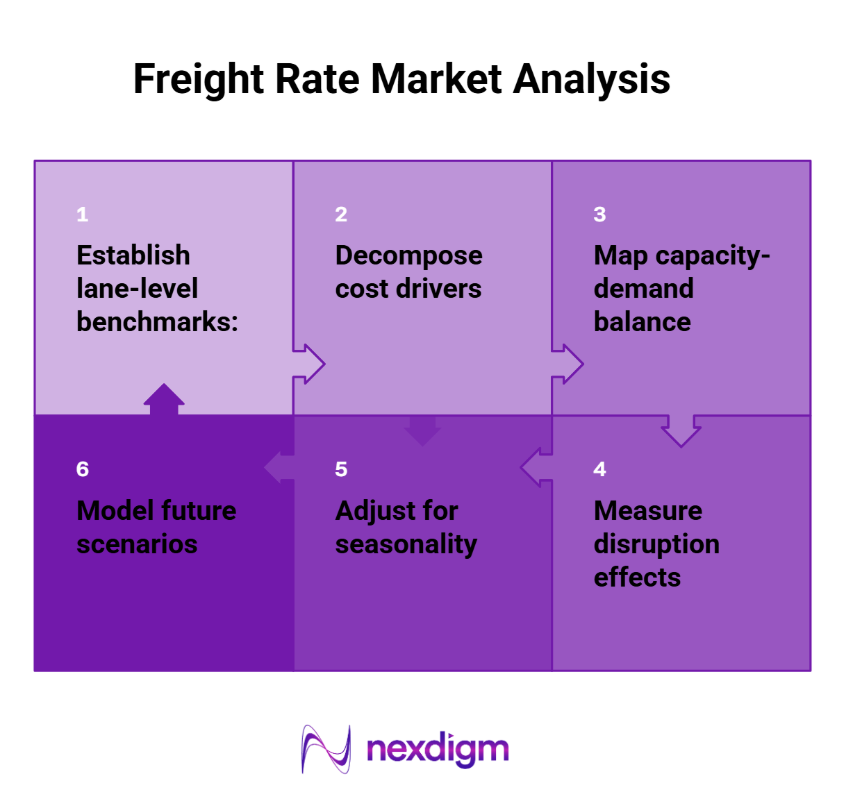
- Establish lane-level benchmarks: Track historical rates by route, mode, equipment type, and customer segment.
- Decompose cost drivers: Measure the contribution of fuel, labour, tolls, handling, equipment, and operating costs.
- Map capacity-demand balance: Compare cargo volumes with available capacity and utilisation to identify pricing pressure.
- Measure disruption effects: Quantify the impact of congestion, rerouting, delays, and equipment shortages.
- Adjust for seasonality: Separate recurring peak-period movements from structural rate changes.
- Model future scenarios: Test rate outcomes under different fuel prices, demand levels, capacity additions, and disruption conditions to support contracting and network decisions.
How Nexdigm Identified the Drivers Behind a Freight Rate Increase
A logistics operator facing a 12% increase in average freight rates across 18 corridors believed fuel inflation was the primary cause. Nexdigm analysed two years of lane-level rates, utilisation, fuel costs, congestion, and shipment volumes and found that only 4.5 percentage points were attributable to fuel. Capacity tightening and weaker backhaul availability accounted for the remainder, leading to a targeted contract renegotiation strategy.
To take the next step, simply visit our Request a Consultation page and share your requirements with us.
Harsh Mittal
+91-8422857704