

A high traffic count can attract attention, but retail performance depends on how much of that traffic can enter, refuel and return to its route. Site selection must combine mobility patterns with local demand, competition, land economics and the network’s operating model.
The demand mix is also changing. Global electric car sales exceeded 20 million in 2025, around one-quarter of new car sales. At the same time, U.S. gasoline consumption averaged 8.9 million barrels per day in 2025, about 1% below 2024 and 4% below 2019. These trends do not mean every market will see the same transition. They do mean that expansion plans should test local vehicle mix and future throughput, not simply extend historical fuel growth.
Measure the catchment, not just the road
Map traffic by direction, time of day, vehicle class and trip purpose. A site on a commuter corridor may have different peak hours and purchase patterns from one serving freight, tourism or local errands. Entry and exit design, visibility, turning restrictions and queueing can determine whether passing vehicles become customers.
Define a practical catchment around each candidate site. Estimate vehicle flows, resident and workplace density, fleet activity, competing forecourts, public transport patterns and nearby retail destinations. Validate desktop analysis with site visits and local operator checks.
A fuel retail opportunity assessment consulting study should also segment demand by fuel type and customer. Private motorists, taxis, delivery fleets, heavy trucks and commercial accounts differ in volume, payment behavior, loyalty and service needs. In markets with growing EV adoption, evaluate charging demand and grid access alongside conventional fuel.
Compare competition and site economics
Competition includes more than the nearest branded station. Map independent outlets, supermarket fuel, highway stops, fleet depots and planned locations. Compare prices, opening hours, product range, forecourt quality, convenience retail and loyalty offers. Identify underserved catchments as well as crowded corridors.
Then test the site’s unit economics. Estimate achievable daily throughput, gross margin, non-fuel sales, labor, utilities, maintenance, rent, construction cost and working capital. For charging, include connection upgrades, equipment, utilization, dwell time and the commercial arrangement with the power provider.
Model ramp-up and downside cases. A site that works only at peak traffic or optimistic market share may not justify a long lease or high upfront investment. Compare owned, leased, dealer-operated and partnership models where relevant. The best format can vary by location and customer mix.
Build a network that can adapt
Expansion decisions should account for the role of each site in the wider network. A location may improve coverage, defend a corridor, secure fleet business or provide a future charging hub. Evaluate cannibalization between existing and planned sites, supply logistics, brand standards and maintenance coverage.
Use a portfolio view to sequence investment. Prioritize locations with strong access, visible customer need, credible margins and manageable capital. Keep options open where land availability or charging demand is uncertain, using staged development or lower-commitment operating arrangements.
Framework: Traffic-to-Return Site Screen
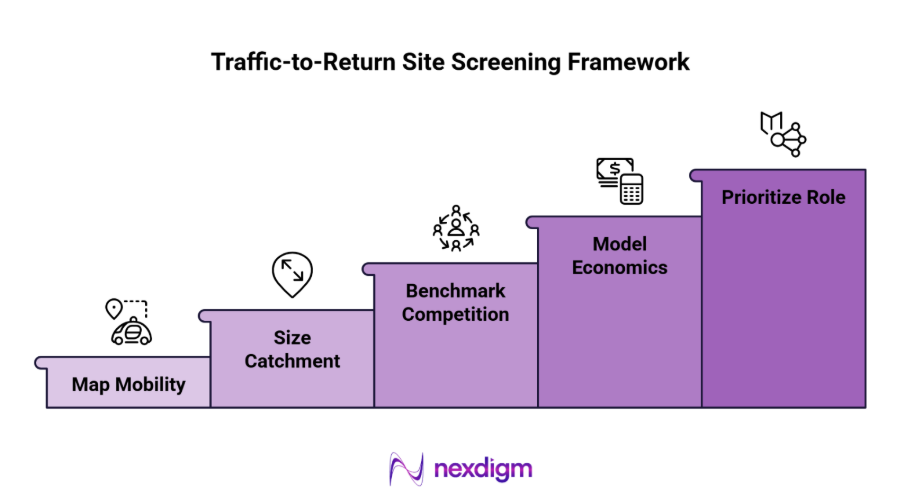
- Map mobility
Measure traffic volume, direction, vehicle type, travel purpose, accessibility and time-of-day patterns. - Size the catchment
Estimate customer pools, fleet activity, fuel mix, retail demand and potential charging use. - Benchmark competition
Compare nearby and planned sites on price, convenience, services, access and customer loyalty. - Model site economics
Test throughput, margins, non-fuel income, rent, capital cost, operating costs and ramp-up sensitivity. - Prioritize the network role
Assess coverage, cannibalization, supply logistics, strategic fit and the option to stage investment.
Nexdigm Case Study
Nexdigm evaluated 26 candidate sites across an urban and highway network, combining traffic patterns, competitor locations, fleet demand, access constraints and site costs. Our model identified seven sites that met the client’s investment threshold under base assumptions; three remained viable in a downside case with lower throughput and slower ramp-up.
The leading highway site was projected to reach break-even 14 months earlier than the network median, while two urban locations showed material cannibalization risk.
To take the next step, simply visit our Request a Consultation page and share your requirements with us.
Harsh Mittal
+91-8422857704