

A fulfilment centre is no longer simply a warehouse positioned near a highway or a low-cost industrial zone. Its location determines how quickly inventory can reach customers, how much transportation the network requires, and how much capital is tied up in additional facilities and safety stock.
For companies promising next-day or same-day delivery, the question is increasingly where inventory needs to sit relative to actual customer demand. The right network balances service levels against facility, transportation, and inventory costs rather than maximizing geographic coverage.
Start With Where Orders Actually Come From
Population is a poor proxy for fulfillment demand. Two areas with similar populations can generate very different order volumes depending on income, category preferences, digital adoption, and commercial activity.
Order data should therefore be mapped at the postal-code or delivery-cluster level. This reveals where demand is concentrated, how frequently customers order, average basket weight, and return patterns.
Seasonality matters as well. Promotional periods, festivals, and weather-driven demand can temporarily increase orders several times above baseline. A facility designed entirely around peak demand may remain underutilized for much of the year, while one sized only for average demand may become a bottleneck when volumes surge.
The Delivery Promise Sets the Geographic Boundary
A delivery promise effectively determines how far inventory can be positioned from the customer.
For standard next-day delivery, a regional facility can serve a relatively broad territory if overnight linehaul and local delivery networks are reliable. Same-day services require a much tighter catchment, while sub-hour delivery models depend on inventory being positioned within a few kilometres of concentrated demand.
The calculation is fundamentally time-based:
Allowable Transit Time = Delivery Window − Order-to-Pack Duration − Sortation Dwell − Dispatch Staging
As the customer promise becomes shorter, the network has less room for long-distance transportation. This creates a multi-echelon model in which fast-moving products are positioned closer to demand while slower-moving inventory remains centralized.
The Existing Network Often Reveals the Next Opportunity
Legacy fulfilment networks can become misaligned with changing demand. Customer migration, new consumption clusters, transportation costs, and e-commerce penetration can leave some facilities overloaded while others operate below capacity.
Three gaps are particularly important:
- Warehouse-to-demand imbalance: Customers may be served from distant facilities despite strong demand in another region.
- Capacity imbalance: High-volume facilities can exceed 90% utilization while secondary facilities remain significantly underused.
- Missing intermediate nodes: Without cross-docks or urban sortation facilities, long-haul shipments may require inefficient transfers and additional delivery mileage.
The decision should therefore compare the cost of maintaining the current footprint with the cost and benefits of alternative network configurations.
More Facilities Do Not Always Mean Better Service
Adding fulfilment centres reduces delivery distances, but it also fragments inventory. Each additional node requires working capital, facility costs, labour, and additional safety stock.
The Square Root Law illustrates the trade-off: as inventory is distributed across more facilities, total safety stock increases approximately with the square root of the number of locations. A network with four additional warehouses may therefore improve delivery performance while creating an inventory burden large enough to offset transportation savings.
The optimal footprint is the point at which the marginal service and transportation benefit of another facility no longer justifies its incremental facility and inventory costs.
Nexdigm’s Research Sugests, Location Has to Be Tested Against the Whole Network
Nexdigm’s fulfilment centre market demand assessment combines customer demand, delivery requirements, network capacity, and cost to determine where additional fulfillment capacity can create the strongest commercial benefit.
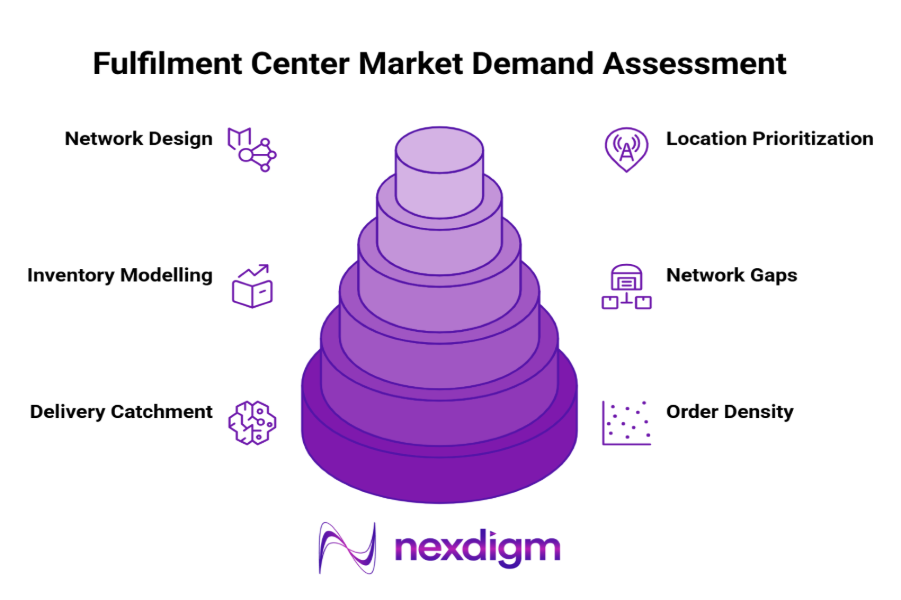
- Order-Density Mapping: Analyse historical orders by postal code, customer cluster, frequency, basket characteristics, and seasonality to establish where sustained demand is concentrated.
- Delivery-Catchment Analysis: Model travel-time zones around existing and potential facilities to test whether each location can consistently meet required delivery windows.
- Network Gap Assessment: Compare warehouse capacity, utilization, inventory positioning, transportation routes, and current delivery performance to identify structural gaps.
- Inventory and Cost Modelling: Evaluate facility costs, inbound freight, local delivery, and inventory holding requirements under different numbers and configurations of facilities.
- Scenario and Location Prioritization: Test candidate locations and network structures to determine whether the business should add regional facilities, urban sortation nodes, cross-docks, or retain a more centralized model.
The outcome is a network design tied to specific service and financial targets rather than a simple list of recommended warehouse locations.
How Nexdigm Identifies the Right Fulfillment Footprint
A multi-channel consumer lifestyle retailer was operating nationally through two central distribution centers covering 650,000 square feet. Despite advertising next-day delivery, only 41% of orders met the promise, while expedited shipping accounted for 18.4% of logistics spending.
Nexdigm analysed 6.8 million order lines across 14,200 postal codes and tested 28 candidate facility locations. The analysis showed that four new fulfillment centers would create excessive inventory fragmentation. Instead, Nexdigm recommended two regional facilities and an urban cross-dock, with fast-moving SKUs distributed across the network and slower inventory retained centrally.
Within 12 months, next-day delivery compliance increased from 41% to 84%, average delivery transit time fell 34%, and outbound parcel costs declined 14.2%. The revised network also reduced the client’s proposed expansion investment by an estimated $8.8 million.
To take the next step, simply visit our Request a Consultation page and share your requirements with us.
Harsh Mittal
+91-8422857704