

International expansion can make a food and beverage brand look larger very quickly. It can also make an expensive mistake look impressively global.
Market entry decisions need to move beyond population size and headline GDP. Food brands operate within specific consumption cultures, price structures, retail systems, import regimes and distribution networks. A market with millions of consumers may offer less practical opportunity than a smaller market with stronger purchasing power, concentrated retail and greater category fit.
Market Size Is Only the First Filter
The USDA’s 2026 international food-expenditure database covers 104 countries and provides comparable data on per-capita food expenditure and food’s share of total consumer expenditure. The data highlights an important structural difference: lower-income countries generally allocate a larger share of consumer expenditure to food, while higher-income economies spend a smaller share as disposable income shifts toward other categories.
For an F&B brand, this means two measures need to be viewed together:
- Absolute consumer spending
- Food expenditure as a share of household spending
High food expenditure does not automatically indicate premium purchasing power. It may instead indicate greater household sensitivity to food prices.
Affordability Changes the Addressable Market
A product positioned at a premium price in one country can become a mainstream product elsewhere, while a mass-market product can become inaccessible after import duties, logistics and distributor margins are added.
Food inflation also matters.
The FAO Food Price Index averaged 127.2 points in 2025, 4.3% higher than its 2024 average, with vegetable oils and dairy among the contributors to higher global food commodity prices.
Entry analysis therefore needs to test the final consumer price rather than simply compare the manufacturer’s domestic price.
The relevant question becomes: after duties, freight, distributor margins, retailer margins and local taxes, where does the product sit against comparable products?
Distribution Can Decide the Market
Food brands need to know whether consumers can actually find the product.
Saudi Arabia provides a useful example. USDA’s 2025 market fact sheet estimates Saudi food retail sales exceeded US$50 billion in 2024 and projects approximately 5% growth in 2025. Five major retail chains represented more than 80% of retail revenues, creating a relatively concentrated route-to-market structure. Saudi Arabia also imports around 70% of its food demand.
That structure can be attractive for an international brand because distribution can potentially be concentrated among fewer major accounts.
However, retailer concentration also increases buyer power and makes listing economics important.
Local Fit Has to Be Tested at Product Level
The same brand proposition does not necessarily transfer unchanged between countries.
Local fit can involve:
- Taste: Flavour profiles, sweetness, spice, texture and portion preferences.
- Dietary requirements: Halal, vegetarian, vegan, allergen and religious considerations.
- Pack architecture: Single-serve, family-size and multipack formats.
- Price points: Entry, mainstream and premium tiers.
- Consumption occasions: Breakfast, snacking, gifting, meal preparation or foodservice.
- Brand communication: Local language, cultural references and category education.
A market-entry assessment should therefore test individual SKUs rather than assuming that the entire domestic portfolio can travel together.
Where Demand and Consumer Fit Intersect
Saudi Arabia illustrates the importance of matching macro opportunity with changing consumption behaviour.
Saudi Arabia’s F&B market is estimated at SAR91.09 billion in 2025 and projected to reach SAR107.85 billion by 2030. The country’s food and beverage market is also influenced by health awareness, fitness trends and changing consumption patterns.
Meanwhile, Saudi GDP grew 4.5% in 2025, with wholesale and retail trade, restaurants and hotels accounting for 12.3% of GDP at current prices.
These figures do not make Saudi Arabia universally suitable for every F&B brand. They illustrate what an entry assessment should examine: market growth, purchasing power, category relevance, channel structure and macroeconomic conditions together.
Indonesia presents a different profile. Its population was approximately 283 million in 2024, with GDP around US$1.46 trillion, and economic growth around 5% in 2023 and 2024, supported by domestic consumption and investment.
The larger population provides scale potential, but geographic complexity across more than 17,500 islands makes distribution and localization materially different from a concentrated market such as Saudi Arabia.
Nexdigm’s Global Market Entry Scorecard
Nexdigm’s global food and beverage market entry strategy helps companies compare countries across demand, affordability, competition, distribution, local fit and entry economics before selecting expansion markets.
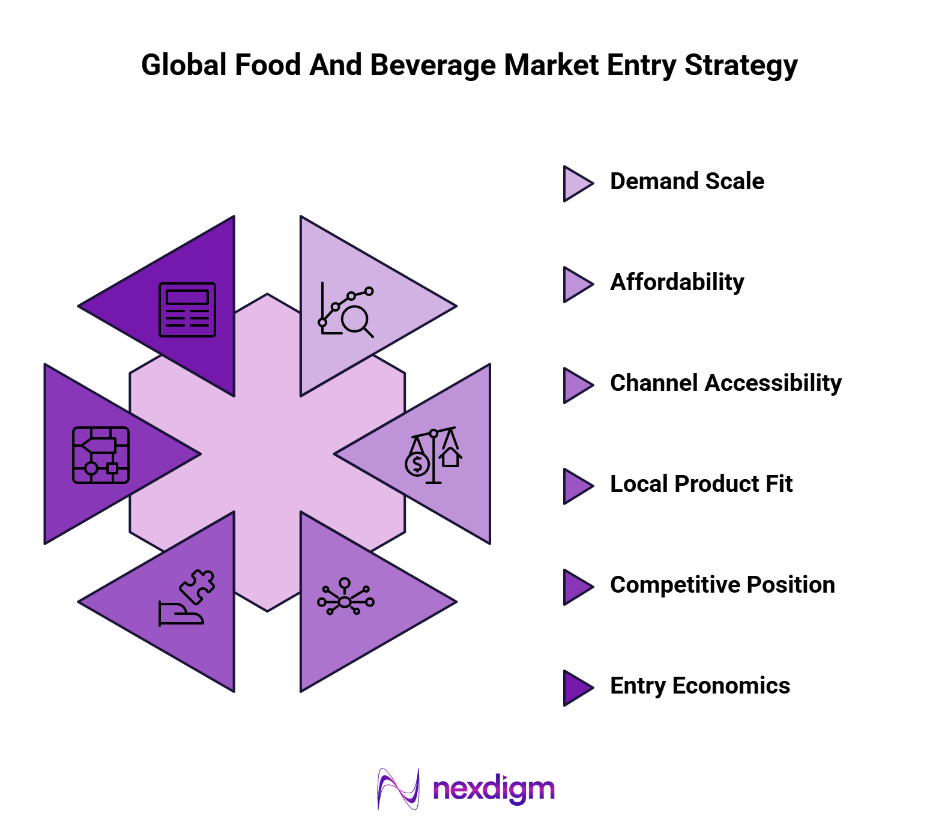
- Demand Scale: Measure category size, growth, consumption frequency and addressable consumers.
- Affordability: Benchmark disposable income, food expenditure, competitive pricing and expected landed price.
- Channel Accessibility: Assess retailers, distributors, e-commerce, foodservice and route-to-market concentration.
- Local Product Fit: Test taste, pack sizes, dietary requirements, price tiers and consumption occasions.
- Competitive Position: Map domestic, regional and international competitors and their market positioning.
- Entry Economics: Model duties, logistics, distributor margins, marketing investment, working capital and expected market penetration.
This approach enables brands to compare markets on commercial accessibility rather than simply ranking countries by headline market size.
Nexdigm Case: Prioritizing International F&B Expansion Markets
Nexdigm evaluated 6 international markets across 14 demand, affordability and channel indicators for an F&B expansion. The assessment narrowed the opportunity to 3 priority markets, where projected category growth ranged from 9% to 15%.
To take the next step, simply visit our Request a Consultation page and share your requirements with us.
Harsh Mittal
+91-8422857704