
Manufacturing demand does not expand at the same pace across countries, industries, or product categories. One region may be investing in electronics and data-centre infrastructure while another is focused on industrial equipment, transport systems, or basic production capacity. Even within a growing economy, demand can vary sharply between sectors.
For manufacturers planning export expansion, the challenge is to identify which growth pools match their products, capabilities, and time horizon. A country’s GDP growth rate is a useful context indicator, but it is too broad to determine where industrial orders will emerge.
Global growth is concentrated, not uniform
UNIDO’s 2025 industrial statistics yearbook reported that global manufacturing value added increased by 2.9% in 2024. Middle-income industrial economies performed more strongly than high-income industrial economies, where manufacturing growth was comparatively subdued. The pattern highlights the importance of examining industrial development and sector composition alongside national economic growth.
More recent trade data show that demand can also be concentrated in a small set of product categories. The WTO’s 2026 outlook reported that AI-enabling goods accounted for 47% of the increase in global merchandise trade value during the first half of the year. That concentration is commercially significant for suppliers of relevant electronics, semiconductors and data-centre equipment, but it should not be treated as evidence that every manufacturing sector is experiencing a similar boom.
Regional demand also reflects investment cycles. Infrastructure spending can raise demand for electrical equipment, steel products, and construction machinery. Industrial upgrading can increase purchases of automation systems and precision components. Changes in consumer demand can influence appliances, vehicles, and packaged goods. The right analysis connects each demand driver to the products that manufacturers actually make.
Follow Investment and Production, Not Headlines Alone
Three indicators help reveal where industrial demand may be building.
- Industrial production and manufacturing value added indicate whether a region’s production base is expanding.
- Imports of capital goods, components and intermediate products can signal investment requirements or dependence on foreign suppliers.
- Announced capacity additions and investment programmes can indicate future procurement, although announcements must be checked against financing, construction progress, and actual orders.
Trade values should be interpreted cautiously. UNCTAD’s 2026 updates noted that rising prices contributed to growth in global trade values, particularly during periods of energy and shipping disruption. A higher import bill can therefore reflect more expensive goods rather than a greater physical quantity of products being purchased. Volume data and unit values are essential when assessing the underlying market.
Manufacturers should also distinguish cyclical demand from structural demand. A temporary rebound in machinery purchases may follow deferred capital expenditure, while sustained investment in power systems, electronics production or transport infrastructure can create a longer order pipeline. Both can be valuable, but they require different sales and capacity strategies.
Regional Growth Pools are Linked Through Supply Chains
Demand in one country can create opportunities for manufacturers in another, even when the final customer is elsewhere. A plant expansion may require imported components, tooling, test equipment and maintenance services. A new assembly operation may source subassemblies from multiple countries. Suppliers can therefore benefit from investment cycles through intermediate goods, not only through exports of finished products.
The OECD’s 2026 work on global value chains found little evidence of widespread reshoring across the economies covered by its analysis for 2023–2024. It also highlighted substantial differences between countries and sectors. For exporters, the implication is that supply-chain participation remains relevant, but the entry point may be a particular production stage or supplier relationship rather than a broad national relocation trend.
A Global manufacturing demand analysis should map demand at three levels: the region’s industrial investment outlook, the sector or value chain receiving that investment, and the specific components or products that suppliers will need. This makes the analysis useful for commercial planning. It helps companies identify not just where spending is rising, but which procurement budgets they can realistically access.
Match the Growth Pool to the Business Model
A fast-growing market may still be a poor fit for a manufacturer whose products require extensive certification or whose production economics depend on large orders. A slower-growing market may offer a stronger opportunity if customers are replacing installed equipment, diversifying suppliers or seeking specialized components.
The comparison should consider order size, qualification timelines, competitive intensity, customer concentration, payment practices, and the cost of supporting customers across distance. It should also account for the likely timing of demand. Suppliers of capital equipment may need to engage early in an investment cycle, while replacement components may offer more recurring opportunities after a facility becomes operational.
Nexdigm’s Regional Growth Pool Prioritisation Framework
A useful prioritisation model compares each region-sector combination across four factors:
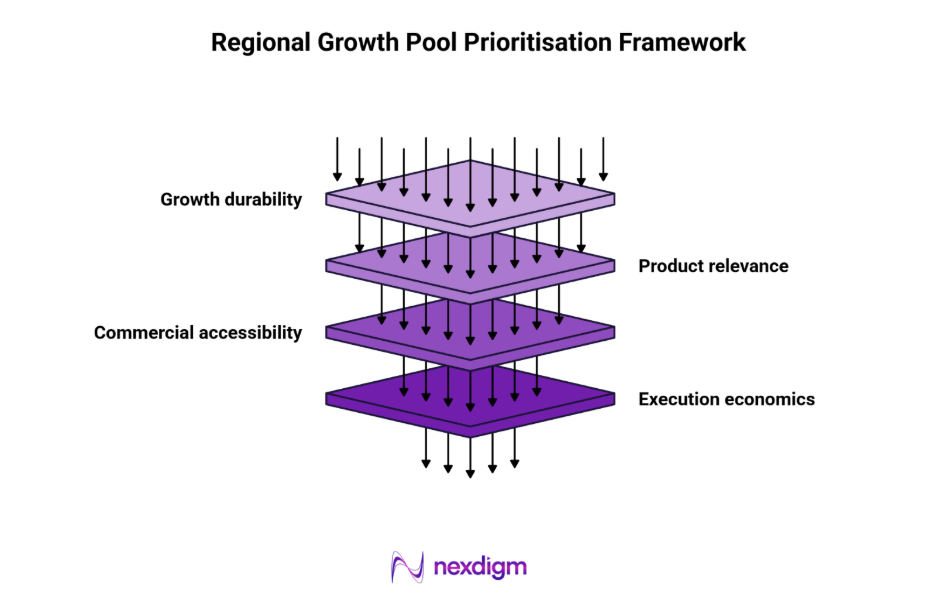
- Growth durability: Industrial production, investment pipeline, import demand, and the distinction between volume growth and price inflation.
- Product relevance: Fit with the manufacturer’s portfolio, technical capability, and potential role in the value chain.
- Commercial accessibility: Tariffs, standards, procurement channels, buyer concentration, and competitive intensity.
- Execution economics: Delivered margin, working capital, service requirements, order timing and capacity availability.
Each candidate growth pool should then be assigned a time horizon: near-term sales, medium-term market development or longer-term capability investment. This allows management to allocate resources across different demand cycles without assuming every promising region needs an immediate market entry.
Nexdigm Case Study: Aligning Export Priorities with Industrial Growth Cycles
Nexdigm assessed regional demand for an Indian manufacturer supplying electrical systems, industrial components and equipment subassemblies. The study compared 8 regional markets across 6 end-use sectors, using industrial production indicators, product-level import trends, planned investment activity, supplier-country shares, and channel interviews.
The assessment identified 3 distinct demand profiles: a near-term replacement market for electrical components, a medium-term opportunity linked to industrial capacity expansion, and a longer-term market tied to new infrastructure investment. Across the product-market combinations reviewed, 11 showed credible demand alignment, but only five met the client’s initial thresholds for market access, delivery feasibility and contribution margin.
To take the next step, simply visit our Request a Consultation page and share your requirements with us.
Harsh Mittal
+91-8422857704