
Global manufacturers today are navigating a landscape defined by cost volatility, supply chain realignments, and evolving sustainability imperatives. As production networks expand across geographies, decision-makers face a critical question of which facilities are driving profitability and which are draining capital?
Plant rationalization and expansion are no longer operational decisions; they are strategic financial choices that determine long-term competitiveness. However, these decisions require more than intuition or standard cost comparisons. They demand precise, data-driven insights into how each plant performs relative to industry peers and global benchmarks.
This is where Financial Benchmarking Studies play a transformative role. By analyzing performance across parameters such as cost per unit, asset turnover, EBITDA margin, and working capital efficiency, manufacturers can identify which facilities offer the highest strategic advantage and which may require consolidation or modernization.
Why Financial Benchmarking Is Critical for Global Manufacturing Optimization
As manufacturing enterprises scale across continents, balancing cost efficiency with production resilience has become increasingly complex. Labor costs, input prices, and trade dynamics differ sharply from one region to another, making it difficult for organizations to evaluate performance on a like-for-like basis. Financial benchmarking bridges this gap by providing a unified lens through which leaders can assess operational efficiency, capital deployment, and profitability across plants and geographies.
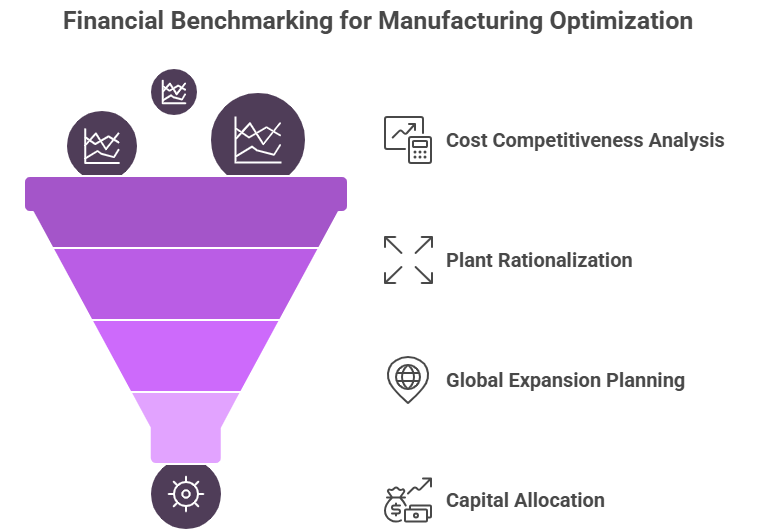
- Visibility Into True Cost Competitiveness: Financial benchmarking allows manufacturers to go beyond accounting metrics and understand the real cost of production. By comparing cost per unit, overhead ratios, and conversion costs across facilities and industry peers, organizations can pinpoint inefficiencies that directly impact profitability. It highlights which plants are achieving cost leadership and which require operational restructuring.
- Data-Driven Plant Rationalization Decisions: Rationalizing plants without empirical data risks underutilization or overcapacity. Benchmarking provides factual clarity by comparing each facility’s contribution margin, utilization rate, and fixed-to-variable cost structure. This enables management to determine which plants to consolidate, expand, or modernize.
- Informed Global Expansion Planning: When evaluating new markets, benchmarking helps identify regions with optimal cost structures and return potential. Manufacturers can assess location-specific advantages such as labor productivity, logistics costs, taxation, and infrastructure quality.
- Capital Allocation and Asset Productivity: Benchmarking also reveals how effectively capital assets are being deployed. Metrics like Return on Capital Employed (ROCE), asset turnover, and EBITDA per ton of production indicate where investments generate the highest returns. This intelligence allows CFOs to prioritize modernization and automation projects that strengthen long-term cost competitiveness.
Nexdigm’s Manufacturing Financial Benchmarking Consulting Framework
At Nexdigm, we understand that every manufacturing decision has deep financial implications. Our Manufacturing Financial Benchmarking Consulting Framework empowers global manufacturers to evaluate plant performance through a holistic, data-driven approach. It combines financial analytics, operational intelligence, and competitive benchmarking to help enterprises build cost-efficient, high-performing, and strategically balanced production networks.
Stage 1: Global Peer and Plant Identification
We begin by identifying a peer group of global and regional manufacturers with similar product portfolios, cost structures, and operational footprints. Simultaneously, internal manufacturing facilities are mapped by location, capacity, and product line to ensure accurate comparability across geographies.
Stage 2: KPI and Ratio Benchmarking
Nexdigm benchmarks each plant and peer facility against key financial metrics, including operating margin, cost per unit, working capital cycle, capacity utilization, asset turnover, and maintenance cost ratio. This highlights which plants drive profitability and which face structural inefficiencies or underutilization.
Stage 3: Regional Cost and Asset Productivity Analysis
Our experts analyze labor, logistics, energy, and material cost differentials across regions to identify locations with favorable cost dynamics. In parallel, asset productivity metrics such as ROCE, asset age, and depreciation intensity are assessed to guide decisions on automation, divestment, or reinvestment.
Stage 4: Scenario Modeling for Rationalization and Expansion
Using predictive financial modeling, Nexdigm simulates multiple plant configuration scenarios. Each scenario quantifies potential savings, payback periods, and profitability shifts, helping leadership select strategies with the best financial outcomes.
Stage 5: Strategic Dashboard and Implementation Roadmap
Insights are presented in a Manufacturing Financial Benchmarking Dashboard, providing plant-level and regional performance visibility. The dashboard highlights priority actions for cost optimization, capacity realignment, and investment focus. Nexdigm then collaborates with decision-makers to design a strategic implementation roadmap aligned with corporate growth and ESG objectives.
Nexdigm’s framework transforms manufacturing data into actionable intelligence — empowering enterprises to rationalize operations, deploy capital wisely, and build globally competitive production ecosystems.
To take the next step, simply visit our Request a Consultation page and share your requirements with us.
Harsh Mittal
+91-8422857704