

Global oil demand is shaped by several industries whose consumption patterns increasingly diverge. Passenger vehicles, freight, aviation, shipping, petrochemical manufacturing and industrial activity each respond to different economic and technological drivers. Electrification can constrain gasoline demand while aviation fuel consumption rises or chemical manufacturers increase their use of hydrocarbon feedstocks.
The International Energy Agency’s (IEA) Global Energy Review 2026 reported that global oil demand increased by 0.7% in 2025, reaching a further slowdown from the previous year’s growth. Weaker petrochemical feedstock demand contributed to the moderation, while electrification and biofuel adoption continued to constrain road-fuel consumption. Emerging and developing economies accounted for nearly all the increase in global oil use, with Asia Pacific contributing a substantial share.
These trends complicate conventional demand forecasting. A global growth rate can conceal declining consumption in one product category and expanding demand in another, with direct implications for refining, trading, distribution and infrastructure investment. A credible global oil demand outlook therefore needs to connect consumption forecasts to the activities that generate demand and the products that serve them.
Track Mobility Through Fleet Turnover, Not EV Sales Alone
Road transport remains a significant source of oil consumption, but its trajectory depends on the interaction between vehicle ownership, utilisation, fuel efficiency and powertrain adoption. Electric vehicle sales indicate the direction of change, although their effect on oil demand accumulates as electric vehicles enter the fleet and replace conventional vehicles that would otherwise consume petrol or diesel.
Passenger mobility should be modelled using vehicle stock, annual distance travelled, average fuel economy and the share of kilometres driven by each powertrain. Freight requires a separate assessment incorporating tonne-kilometres, truck utilisation, vehicle efficiency and substitution by rail, natural gas or other fuels. The resulting outlook will differ by region because fleet age, infrastructure, income levels and transport policy influence the pace of substitution.
Aviation and shipping require different indicators. Aviation fuel demand follows passenger traffic, cargo volumes, route distances and aircraft efficiency. Maritime fuel consumption depends on seaborne trade, voyage lengths, vessel speeds, fleet composition and fuel regulations. Growing transport activity does not necessarily translate into proportionate oil demand if efficiency improves or alternative fuels gain adoption.
For investors, these distinctions help identify which products and markets remain exposed to mobility growth and which face structural substitution risks.
Follow the Barrel Into Chemicals, Construction and Industry
Petrochemical feedstocks introduce a different set of demand drivers. Naphtha, ethane and liquefied petroleum gas are used to produce plastics, synthetic fibres and other chemical products. Their consumption depends on chemical capacity, operating rates, feedstock availability and demand from downstream industries such as packaging, automotive manufacturing, construction and consumer goods.
The IEA’s Oil 2025 outlook projected that petrochemicals would become the dominant source of incremental oil demand from 2026 onwards, reflecting continued expansion in polymer and synthetic-fibre production. However, the IEA’s subsequent 2026 review reported weaker feedstock demand growth in 2025. This illustrates why capacity announcements alone cannot establish future consumption: new plants may face trade disruptions, weak downstream demand, lower utilisation or changing feedstock economics.
Other industrial applications need separate treatment. Diesel consumption in mining, construction and agriculture responds to equipment use, commodity production and infrastructure activity. Industrial fuel demand depends on process requirements and the relative economics of oil, natural gas and electricity. Recycling and material efficiency may constrain virgin petrochemical demand, but their impact depends on collection infrastructure, recycled-material quality, regulation and the feasibility of substitution in specific applications.
Regional differences matter as well. A market expanding its petrochemical production capacity may experience rising feedstock demand even when road-fuel consumption stagnates. Another may retain strong transport demand because vehicle ownership and freight activity continue to grow. Combining these markets into a single forecast can obscure the opportunities and risks facing individual product portfolios.
Build Scenarios Around Physical Activity and Substitution
A robust assessment starts with a product-by-sector account using official energy balances, refinery output, trade statistics and sector-specific activity indicators. The model should reconcile estimated consumption with observed supply and demand balances, accounting for inventory movements and differences in reporting conventions.
Scenarios should then test the variables most likely to change the trajectory: vehicle electrification, fuel efficiency, aviation activity, freight growth, petrochemical capacity, industrial output, recycling and policy-driven fuel substitution. Assumptions should be explicit, particularly where announced projects have yet to reach investment approval or where adoption rates remain uncertain.
Accounting discipline is essential. Biofuels must be tracked separately from petroleum products, while petrochemical feedstocks must be distinguished from fuels burned for energy. Otherwise, the model can overstate demand or double-count substitution effects. Forecast ranges are more useful than a single precise estimate when they reveal which assumptions materially affect product-level outcomes.
Demand Outlook to Portfolio Strategy Framework
Nexdigm can use this segmentation to evaluate demand exposure across products, industries and regions, connecting consumption forecasts with refining strategy, market prioritisation and infrastructure requirements. The assessment should follow five analytical stages:
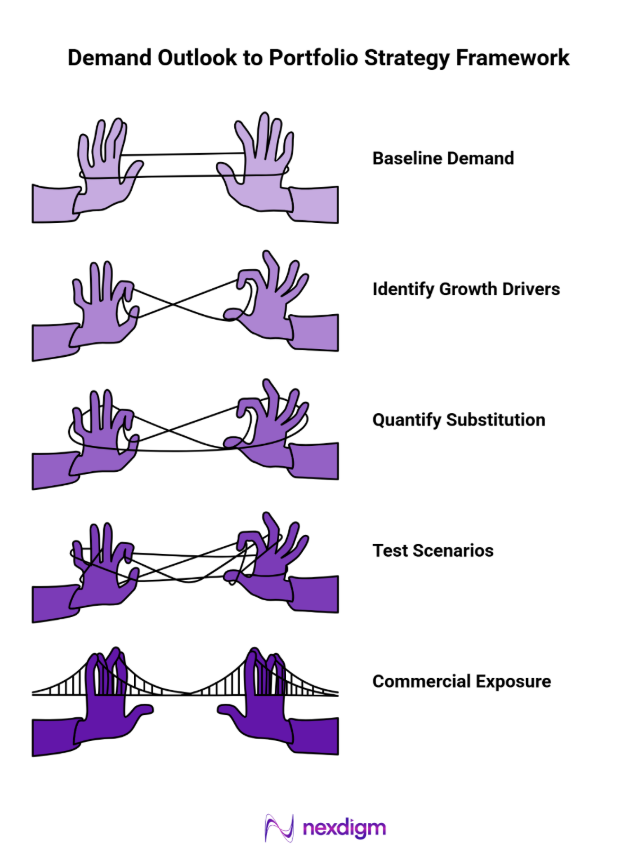
- Establish the demand baseline: Reconcile oil consumption by product, sector and region against official energy balances and observed market data.
- Identify the physical growth drivers: Link each demand category to measurable activity, including vehicle kilometres, freight movement, air travel, industrial output and chemical production.
- Quantify substitution and efficiency: Estimate how electrification, alternative fuels, efficiency improvements and material circularity affect petroleum consumption over time.
- Test regional and product scenarios: Compare alternative assumptions for economic growth, capacity utilisation, policy and technology adoption to identify where demand trajectories diverge.
- Translate forecasts into commercial exposure: Assess implications for refinery product mix, feedstock sourcing, distribution networks and investment priorities, including the sensitivity of returns to slower-than-expected demand growth.
This approach allows decision-makers to distinguish durable demand drivers from temporary cyclical increases and align capital allocation with the specific products and markets in which they operate.
Nexdigm Case: Reassessing Product Exposure
An assessment models road transport, aviation, shipping, industrial use and petrochemical feedstocks across 12 regions through 2035. The scenarios indicate slower gasoline growth alongside stronger demand in selected aviation and chemical segments. The client uses the findings to test refinery exposure and prioritise investments under alternative demand trajectories.
To take the next step, simply visit our Request a Consultation page and share your requirements with us.
Harsh Mittal
+91-8422857704