

For supply chain service providers, geographic expansion is increasingly a network decision rather than a simple market-size exercise. The largest cities continue to attract substantial logistics demand, but they also carry higher real-estate costs, congestion, labour costs and competitive intensity. Meanwhile, manufacturing clusters and distribution corridors are creating demand in markets that may look smaller on a conventional population or GDP ranking.
Demand Is Moving Beyond the Traditional Gateway
India’s industrial and warehousing market still has strong concentration in established logistics centres. During H1 2026, the top eight cities recorded about 22 million sq. ft. of Grade-A leasing, up 12% year-on-year. 3PL providers accounted for around 30% of leasing, making them the largest occupier segment.
Delhi NCR and Chennai alone contributed more than 45% of demand.
The more interesting signal sits outside those headline numbers. Pune, Ahmedabad and Kolkata recorded leasing growth of 30% or more during the same period.
This does not mean that every secondary market represents an attractive expansion opportunity.
It indicates that demand is becoming more geographically distributed, creating a larger set of markets that deserve screening.
Manufacturing Clusters Can Create Stronger Logistics Demand
A city’s population is a poor substitute for understanding freight generation. Automotive components around Pune, electronics and engineering activity around southern manufacturing corridors, pharmaceuticals in Gujarat and distribution activity around eastern gateways can generate concentrated requirements for warehousing, transportation, inventory management and value-added logistics.
This is particularly relevant as India’s manufacturing base expands. Infrastructure development, industrial corridors and new production investments can create logistics demand around specific clusters before that demand becomes visible in conventional city-level market rankings.
The expansion decision should therefore begin with the industries generating freight, the companies operating within them and the logistics services they currently purchase.
Infrastructure Determines Whether Demand Is Reachable
A promising customer cluster can still be commercially unattractive if the physical network makes it expensive to serve.
Road connectivity, freight corridors, rail access, logistics parks, port proximity and the quality of last-mile connections influence both service reliability and asset utilisation.
The location of a warehouse matters because of the routes it enables, not simply because industrial land is available there.
This is becoming more important as India’s logistics infrastructure expands. Colliers identified 30 high-potential industrial and warehousing hotspots in 2026, including 22 emerging or nascent hubs, reflecting the role of infrastructure expansion and manufacturing growth in reshaping the logistics map.
The Largest Market May Not Offer the Best Margin
Scale can conceal poor economics. Prime logistics markets provide access to established customers, but competition for Grade-A space, labour and strategic locations can compress returns. In H1 2026, new industrial and warehousing supply across the top eight cities reached about 25 million sq. ft., exceeding the 22 million sq. ft. of demand recorded during the period.
A new entrant therefore must consider the economics of winning and serving customers, not simply the size of the addressable market. A smaller industrial corridor with fewer incumbent providers, lower occupancy costs and strong anchor demand may produce a better entry case than a much larger but saturated market.
Expansion Is Becoming a Portfolio Decision
The geographic opportunity is also changing at the network level. JLL reported that India’s 3PL sector had accumulated more than 110 million sq. ft. of gross warehouse absorption between 2021 and H1 2026, making it the largest occupier segment. CBRE has also found that around 80% of 3PL players planned to expand their portfolios by more than 10% over the following two to five years.
With so many providers expanding simultaneously, entering a market first is not enough. The stronger proposition comes from identifying where a new facility, transport node or customer cluster strengthens the existing network rather than simply adding another location.
How Nexdigm Ranks Supply Chain Expansion Markets
Nexdigm’s global supply chain entry feasibility reports can structure market screening around six decision areas:
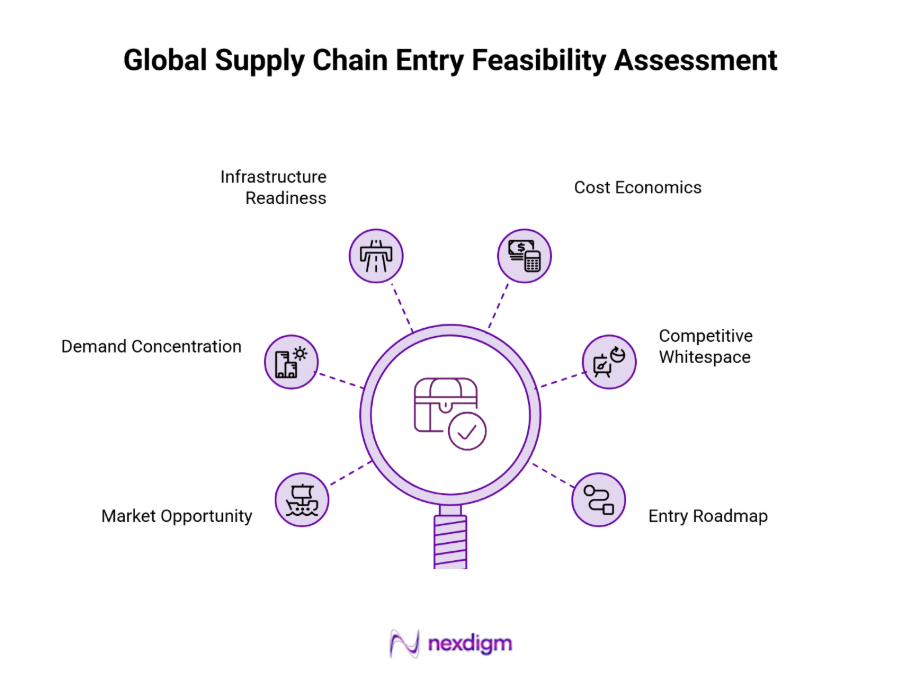
- Market opportunity: Size the addressable freight and contract-logistics pool and isolate contestable demand.
- Demand concentration: Map manufacturing clusters, retail activity, customer density and freight-generation intensity.
- Infrastructure readiness: Assess highways, freight corridors, railheads, ports, logistics parks and multimodal connections.
- Cost economics: Compare rent, labour, utilities, transport costs and other local operating factors against expected revenue and utilisation.
- Competitive whitespace: Identify incumbent providers, customer lock-ins, available capacity and underserved service requirements.
- Entry roadmap: Rank markets by commercial attractiveness and define the appropriate sequence, investment level and operating model.
The output is a market ranking tied to actual network economics rather than a broad geographic attractiveness score.
Nexdigm Case: Screening Markets Before Network Expansion
A major logistics enterprise evaluated network expansion across multiple high-growth trade markets to improve regional distribution and reduce customer transit delays. Nexdigm assessed 3 candidate commercial trade zones, examining industrial customer concentration, road connectivity, Grade-A warehouse availability and delivery-radius constraints. The assessment shortlisted 2 viable regional hub locations. The resulting network architecture was projected to reduce regional distribution costs by 14%–16%, expand same-day and next-day delivery coverage by 35%, and reduce average customer transit times by 25%.
For logistics providers evaluating expansion, the practical value lies in distinguishing a market with visible demand from one where that demand can be converted into profitable network capacity.
To take the next step, simply visit our Request a Consultation page and share your requirements with us.
Harsh Mittal
+91-8422857704