

Customs records can reveal which products countries buy, where imports originate and how supplier relationships change over time. For an exporter, manufacturer, or procurement team, this information can help identify new markets, qualify sourcing options, and investigate competitors. Yet a database of trade flows is not a commercial strategy. The value comes from connecting recorded transactions to a plausible customer need, a reachable market and a profitable route to serve it.
Start With the Right Product Definition
Trade analysis begins with product classification. Customs systems organise goods through standardised codes, but the categories may not align perfectly with a company’s product portfolio. One code can cover several grades or applications, while relevant substitutes may sit under different classifications.
The United Nations’ Comtrade database allows users to examine trade by product, reporting country, partner country, period and trade flow. These dimensions provide a foundation for comparing destinations and suppliers. Before drawing conclusions, however, analysts should check the classification’s scope, reporting coverage and availability of recent data. National reporting schedules vary, and some countries provide monthly data while others publish annual figures or revise earlier records.
A poorly defined product category can inflate the apparent market size. The first task is therefore to establish which codes best represent the product being sold and whether the resulting data captures its actual customer market.
Find the Commercial Signal Inside the Records
Once the product is defined, analysts can compare imports across destinations, identify leading supplier countries, and track changes over time. A market with sustained import growth may deserve further investigation, but the reason for that growth matters. Rising values could reflect higher prices, increased physical demand, a shift towards premium products, or a temporary supply disruption.
The World Trade Organization’s October 2026 outlook raised its forecast for global merchandise trade volume growth to 3.9% for 2026, following stronger-than-expected trade in the first half of the year.
The report identified AI-related investment as a significant driver of goods trade.
This is a useful illustration of why aggregate growth should lead to product-level questions: opportunities linked to data-centre infrastructure, for example, will not translate into equal demand across unrelated product categories.
Trade data becomes more commercially useful when it reveals a specific change, such as a new supplier gaining share, a destination importing more of an industrial input or an established source losing ground.
From Country Rankings to Qualified Opportunities
A global trade data analysis exercise should not stop at ranking countries by import value. It should explain why the market matters to the business and what must be true for the opportunity to be captured.
For each promising destination, analysts should establish the relevant customer industries, likely purchasing channels, competitive alternatives, and landed-cost position. An importer may purchase through a local distributor rather than directly from overseas manufacturers. A manufacturer may rely on approved vendors, long qualification cycles, or product certifications. These details determine how much of the apparent market is realistically accessible.
A practical opportunity assessment should answer four questions:
- Who buys the product? Identify the industries and customer types that use it.
- Why are they buying more or changing suppliers? Test whether the trade movement reflects demand, pricing, or supply disruption.
- Can the company compete? Compare specifications, delivered costs, service requirements and existing supplier advantages.
- What must happen next? Define the customer research, partner validation, or product testing needed before investment.
Turning Customs Data into a Commercial Workflow
Trade records are strongest at identifying patterns. They are less capable of explaining buyer motivation, contract terms, or the commercial relationship behind an individual flow. Companies should combine them with company filings, industry directories, procurement notices, regulatory information, and customer interviews.
The resulting analysis should also distinguish observed evidence from assumptions. Recorded imports are a historical fact; the share a new entrant can win is a forecast. Treating the two as equivalent can lead to unrealistic sales targets and premature investment.
For sourcing decisions, the same discipline applies. A country exporting large volumes may contain both manufacturers and trading intermediaries. Supplier qualification should verify production capacity, quality systems, delivery reliability, compliance and financial stability rather than relying on export totals alone.
What to Verify Before Acting on a Trade Signal
- Check product codes and reporting coverage before comparing countries.
- Compare quantities and values to distinguish demand changes from price effects.
- Investigate the companies, industries, and supply chain relationships behind the pattern.
- Test tariffs, freight, standards, and distribution costs for the target market.
- Set a clear next step, such as customer validation, supplier qualification or a limited market pilot.
Nexdigm’s Customs-to-Opportunity Framework
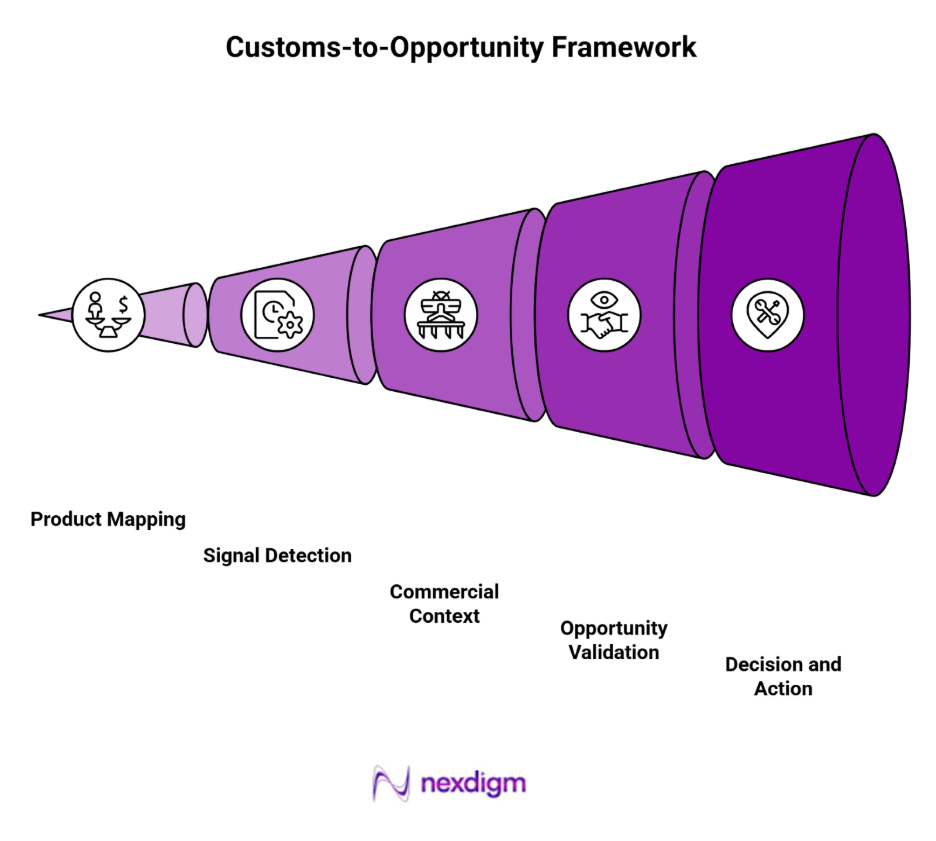
- Product Mapping: Identify the specific products, HS codes, end-use applications, and cross-border trade routes relevant to the analysis.
- Signal Detection: Identify meaningful changes in import and export volumes, supplier shares, and destination demand.
- Commercial Context: Explain the likely commercial or supply chain drivers behind each change.
- Opportunity Validation: Verify buyer relevance, competitive positioning, and market access requirements.
- Decision and Action: Translate the strongest findings into sales, sourcing, or investment decisions.
Nexdigm’s Case Study
A manufacturer of industrial filtration equipment assessed 8 export markets with combined annual imports of approximately US$120 million. Product-level customs analysis found that 3 high-value markets had limited demand for the company’s existing specifications, while 2 smaller markets showed stronger product alignment and more accessible distribution channels. Nexdigm’s assessment prioritised these markets for customer validation, with distributor capability checks and landed-cost modelling guiding the next phase of expansion.
To take the next step, simply visit our Request a Consultation page and share your requirements with us.
Harsh Mittal
+91-8422857704