

A healthcare vendor may be gaining ground because it is winning new buyers, shipping more frequently to existing customers, or expanding into a different product category. These patterns can look similar in headline trade values, but they imply different competitive strengths and risks.
Shipment and trade analysis helps separate vendor momentum from short-term fluctuations. For manufacturers and distributors, the objective is to understand which suppliers are expanding their reach, where they are gaining traction and whether the pattern creates a credible threat or partnership opportunity.
Measuring Vendor Momentum Beyond Shipment Counts
Counting shipments alone can misrepresent competitive performance. One large order may generate fewer records than multiple small deliveries, while a rise in shipment frequency may reflect smaller consignments rather than greater sales. The strongest assessment uses several indicators together.
- Shipment frequency: Measures how often a vendor ships to a buyer or destination. It can indicate continuity but should be interpreted alongside quantity and value.
- Buyer breadth: Tracks the number of distinct importers or customers associated with a vendor, where records identify them reliably.
- Destination coverage: Shows whether a vendor is expanding into additional markets or concentrating on existing ones.
- Product mix: Reveals whether activity is spreading into new categories or deepening within established products.
- Trade value and quantity: Helps distinguish higher shipment activity from actual growth in reported value or physical volume.
Each indicator has limitations. Customs value may not equal the vendor’s net revenue, and product descriptions may be too broad to support direct comparison.
Normalising records and comparing equivalent products is essential before ranking vendors.
Why Product Mix Can Change the Competitive Picture
Healthcare supply chains are particularly sensitive to product classification. A vendor focused on high-value diagnostic equipment may report lower shipment frequency, but substantial value per shipment. A consumables supplier may serve more buyers and ship more frequently yet have lower average shipment value.
Market structure also differs by product. Pharmaceutical ingredients can have concentrated upstream sources, while finished devices may be sold through several distributors. For instance, the concentration of penicillin API imports into the EU, where China supplied 86% by 2025, illustrates how a vendor or origin-country position can be dominant within one product segment without representing the entire pharmaceutical market.
Competitive analysis should therefore compare vendors within comparable product categories and destinations. Combining all healthcare products into one ranking can hide the suppliers that matter most in a specific segment.
Using Healthcare Vendor Trade Analysis to Track Competitive Change
Effective healthcare vendor trade analysis combines shipment activity, buyer relationships, destination coverage and product mix to identify which suppliers are gaining ground.
Comparing these indicators across multiple periods helps distinguish sustained competitive growth from one-off orders, seasonal fluctuations or changes in data coverage.
- Track share of observed activity: Compare each vendor’s share of shipment records, quantities or values within a defined product-market dataset. Label these as shipment or dataset shares, not total market share, unless the data is demonstrably comprehensive.
- Identify new buyer relationships: Monitor first-observed shipments and repeat activity, then validate whether the relationship continues.
- Measure geographic expansion: Compare destinations over time and distinguish new market entry from one-off deliveries.
- Detect portfolio shifts: Identify changes in product categories and assess whether they suggest diversification or a narrower strategic focus.
- Investigate anomalies: Check abrupt increases or declines against seasonality, procurement cycles, data gaps and route changes before interpreting them as competitive wins or losses.
The analysis should produce a shortlist of vendors gaining meaningful traction, losing visibility, or changing their product-market focus, along with the evidence behind each assessment.
Nexdigm’s Vendor Momentum Assessment Framework
Nexdigm can evaluate competitive movement through four stages:
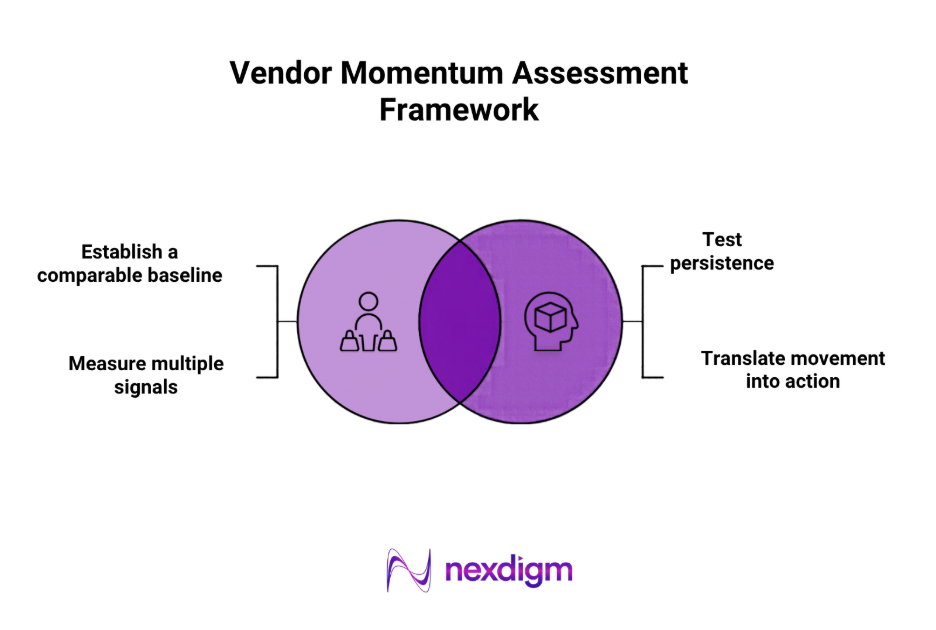
- Establish a comparable baseline: Clean company identities and align products, destinations and periods before comparing vendors.
- Measure multiple signals: Combine shipment activity, buyer breadth, product mix and available value or quantity data.
- Test persistence: Check whether changes recur across periods and buyers rather than being driven by one transaction.
- Translate movement into action: Identify vendors to benchmark, monitor, approach as potential partners or evaluate as competitive threats.
The result is a defensible view of vendor momentum, with a clear distinction between observed activity and confirmed market position.
Case Study: Identifying Vendors Gaining Traction
A medical-supplies distributor compared 24 vendors across 6 product categories and 8 destination markets over 12 months. Five vendors increased their share of observed shipment activity; three also expanded their buyer base. The distributor prioritised those three for product benchmarking and channel strategy reviews.
To take the next step, simply visit our Request a Consultation page and share your requirements with us.
Harsh Mittal
+91-8422857704