
Manufacturing enterprises across the world are accelerating their automation journeys integrating robotics, IoT-enabled systems, and AI-driven process controls to enhance productivity and consistency. Yet, as automation becomes the norm rather than the exception, a new challenge has emerged: how to measure the true financial impact of these investments.
While automation promises efficiency, cost savings, and quality improvements, not all initiatives yield proportionate financial returns. Many manufacturers invest heavily in advanced technologies without a structured mechanism to evaluate whether automation has genuinely improved capital efficiency, asset productivity, or profitability.
This is where Financial Benchmarking becomes a critical enabler. By comparing key metrics such as Return on Capital Employed (ROCE), cost per unit, EBITDA margin improvement, and automation payback period against peers and internal baselines, manufacturers can gain a clear, data-backed understanding of their automation ROI.
Why Financial Benchmarking Is Essential for Measuring Automation ROI
For most manufacturers, automation has evolved from a productivity tool into a strategic growth enabler. However, as automation programs scale, so do capital outlays, maintenance costs, and system integration complexities. Financial benchmarking bridges this gap by connecting technical outcomes with fiscal performance. It translates operational achievements into quantifiable financial metrics like margin uplift, asset utilization, and return on investment (ROI).
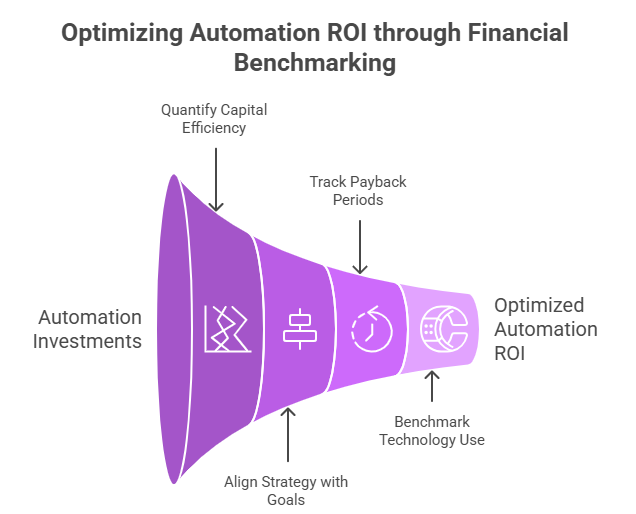
- Quantifying Capital Efficiency and ROI: Automation initiatives often involve multi-million-dollar capital expenditures. Benchmarking provides an objective method to evaluate how effectively this capital is being utilized. By comparing ROCE, fixed asset productivity, and depreciation-to-output ratios with peers, manufacturers can determine if automation projects are financially justified and performing above or below industry standards.
- Aligning Automation Strategy with Financial Goals: While engineering teams focus on throughput and precision, CFOs and investors focus on profitability. Financial benchmarking harmonizes these perspectives by revealing whether automation investments are translating into improved cost efficiency, lower working capital requirements, and better bottom-line performance.
- Tracking Payback Periods and Cash Flow Impact: Benchmarking helps assess the time-to-value of automation projects by comparing their payback periods and cumulative cash flow impact with industry averages. This enables leadership to refine capital deployment strategies and avoid overinvestment in technologies with slow or uncertain returns.
- Benchmarking Technology Utilization and Performance: Through peer-based analysis, benchmarking uncovers whether automation systems are operating at optimal capacity or underutilized. Metrics such as OEE (Overall Equipment Effectiveness), maintenance cost per asset, and energy cost per output provide actionable insight into operational and financial optimization opportunities.
Nexdigm’s Industrial Automation Financial Benchmarking Framework
At Nexdigm, we recognize that successful automation is about ensuring measurable financial returns from every investment. Our Industrial Automation Financial Benchmarking Framework empowers manufacturers to evaluate automation impact through a fiscal lens, integrating financial analytics, operational data modeling, and peer intelligence to drive capital efficiency and ROI visibility.
Stage 1: Peer Mapping and Baseline Establishment
We begin by identifying global and regional peers with similar levels of automation maturity, production scale, and process complexity. Internal plant data is also standardized to establish a financial baseline for comparison, ensuring benchmarking outcomes are both accurate and relevant.
Stage 2: KPI and Ratio Benchmarking
Nexdigm benchmarks key financial and operational metrics such as Return on Capital Employed (ROCE), cost per unit, automation-related margin improvement, payback period, and EBITDA-to-revenue ratio. This step quantifies how automation is influencing cost efficiency, profitability, and capital productivity.
Stage 3: Cost and Asset Productivity Evaluation
We assess cost structure changes driven by automation while measuring fixed asset productivity, throughput gains, and downtime reduction. These insights highlight whether automation is generating tangible value or merely increasing capital intensity.
Stage 4: Scenario Simulation and ROI Forecasting
Using financial modeling, Nexdigm simulates multiple automation scenarios to project ROI and payback outcomes. This helps CFOs and manufacturing leaders make data-backed investment decisions for future automation projects.
Stage 5: Automation Financial Dashboard and Strategic Insights
The results are consolidated into a Financial Benchmarking Dashboard, a visual decision-support tool that showcases performance gaps, efficiency improvements, and ROI progress across plants or production lines. It enables leadership teams to continuously track automation-driven financial value and reallocate capital more effectively.
Nexdigm’s framework transforms automation evaluation from a one-time review into a continuous financial governance mechanism, ensuring every automation investment contributes directly to improved capital efficiency, fiscal discipline, and enterprise competitiveness.
To take the next step, simply visit our Request a Consultation page and share your requirements with us.
Harsh Mittal
+91-8422857704