

Industrial investment decisions are often presented as a contest between fast-growing economies. That comparison is incomplete. A country can record strong manufacturing growth while a particular product category has excess capacity, weak margins or no reliable route to customers. Conversely, a slower-growing market may need a critical component, have dependable buyers and lack enough local supply. The investable question is therefore where demand, a genuine capacity gap and an operator’s capabilities overlap.
Recent data show why an aggregate view can mislead. UNIDO’s 2025 industrial statistics put global manufacturing value-added growth at 2.9% in 2024, while its Q2 2026 production and trade update reported growth in both manufacturing output and exports, with the export increase materially stronger. Those measures describe different things: output reflects production, while export values also reflect prices, product mix and cross-border shipments. A capital plan should look below the global total to industry, product and destination.
Compare the Full Cost of Producing and Selling
Demand should be reconstructed from end users, not inferred from a country GDP forecast. For industrial equipment, that may mean construction starts, grid investment or factory orders. For materials, it may mean customer production volumes and input substitution. Translate these indicators into addressable units, then test what share an entrant could realistically win against domestic producers and imports. Trade data are useful, but import value alone does not prove a local supply shortage: imports may be higher quality, contractually preferred or temporarily cheaper.
The cost comparison must include more than wages. Energy reliability, freight, financing, land, yields, maintenance, inventory, customs and the cost of meeting standards all affect delivered cost. UNCTAD greenfield announcements help identify where firms plan new facilities, but announced projects are a pipeline signal rather than proof that plants are operating or economically viable. Capacity utilization, plant commissioning, production statistics and customer contracts are needed to verify whether an apparent gap is real.
In clean technology manufacturing, the IEA’s 2026 assessment shows that investment can retreat even while end markets grow. Capacity additions in solar and batteries outpaced current demand in some parts of the value chain, leaving oversupply and weaker need for new plants. The IEA also finds that regional production-cost differences arise from several sources, including process efficiency, energy, labor and supply-chain depth. The implication is practical: the lowest headline labor cost does not guarantee the lowest delivered unit cost, and a policy incentive cannot repair a structurally weak margin.
Match the Opportunity to the Investor
An opportunity should be scored against the investor’s actual strategic assets. A company with process know-how, customer qualification and trusted suppliers may enter a market where a greenfield competitor would struggle. Another firm may find that acquiring a local producer is faster than building supplier relationships, even if the acquisition price is higher. A market that scores well on demand and cost can still be a poor fit if the company lacks the required technology, certification, service network or appetite for regulatory exposure.
This is where industrial investment opportunity analysis should distinguish a market screen from an investment decision. The screen identifies promising country-product combinations. The investment case tests customer-level prices, ramp-up, utilization, capital needs, cash conversion and downside exposure. Scenario work should include slower qualification, lower utilization, input-price shocks, exchange-rate moves and delayed infrastructure. Nexdigm’s market assessment work can connect these commercial and operational tests so that a growth ranking leads to a specific capital choice.
An investment comparison should also account for time to revenue. A project that needs four years for permitting, construction and customer qualification may be less attractive than a smaller brownfield upgrade that generates cash in twelve months. Include the cost of waiting, the risk that competitors add capacity first and the value of keeping an option open. Where product demand is tied to a few large projects, build a probability-weighted sales case rather than counting every announced project at face value. This makes the comparison sensitive to execution, not just to a forecast point estimate.
Industrial Capital Allocation Framework
The framework can be applied through four investment tests:
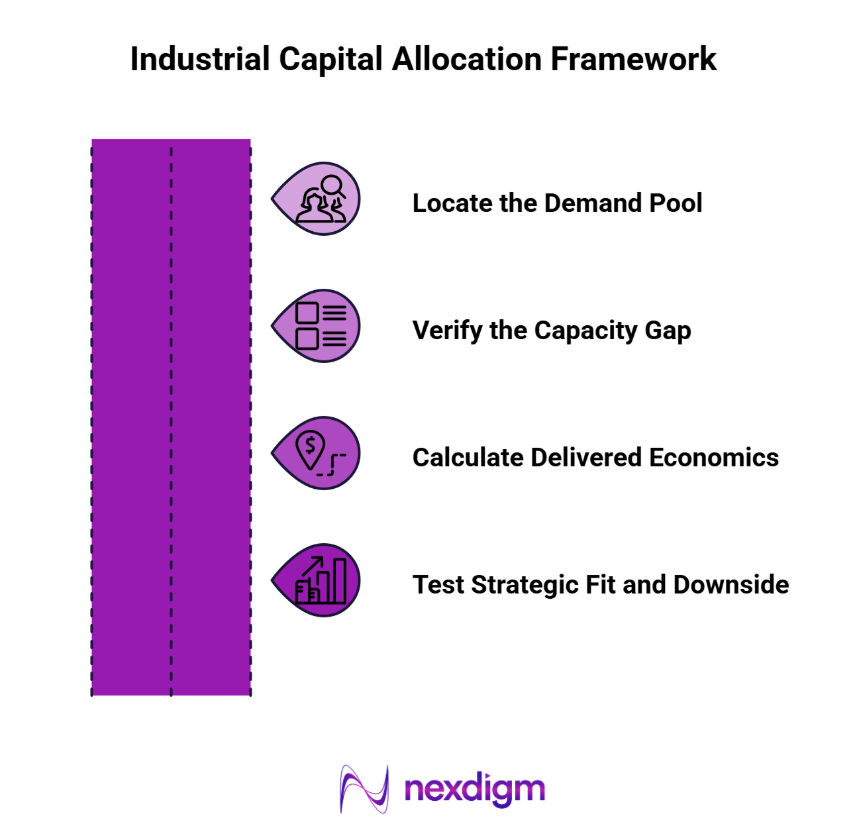
- Locate the Demand Pool Identify customer industries, product requirements and evidence of durable consumption. Separate current orders and replacement demand from policy targets or announced projects.
- Verify the Capacity Gap Map operating and planned supply, imports, utilization and customer qualification. Treat project announcements as pipeline evidence until commissioning and output are verified.
- Calculate Delivered Economics Compare full landed and produced cost, including energy, freight, financing, yields, compliance and working capital. Stress test prices and ramp-up assumptions.
- Test Strategic Fit and Downside Assess capabilities, customer access, partners, policy exposure and alternative entry modes. Advance only options that meet return thresholds under a plausible downside case.
Nexdigm can use these tests to rank investable product-market combinations and clarify whether the next step is a plant, acquisition, partnership or further diligence.
Nexdigm Case Study
In an assessment, Nexdigm compared three industrial components across four Southeast Asian markets for a European equipment supplier. Demand interviews, customs and capacity data narrowed the list to two. A Malaysia assembly partnership met modeled margins at 68% utilization and avoided a higher-cost greenfield build.
To take the next step, simply visit our Request a Consultation page and share your requirements with us.
Harsh Mittal
+91-8422857704