

Industrial demand is often overstated when products are grouped too broadly. A pump, sensor, seal or process component may serve several applications, but the buyer’s reason to purchase differs by operating conditions. One customer buys to prevent downtime; another needs higher throughput; a third must meet a new technical or safety requirement.
The forecast should therefore start with the application and the purchase trigger, not a global market total. In the second quarter of 2026, global manufacturing production rose 1.5%, while higher-technology production grew 2.0%. The stronger growth in higher-tech exports, up 7.1%, points to changing production mix. It does not mean every industrial supplier shares the same demand curve.
Trace the product into the plant
For each end-use application, identify where the product is installed, what it does and what happens when it fails. Then map the value chain from specification to purchase: engineer, plant manager, procurement, distributor, installer and service provider may all influence the decision.
A useful demand estimate separates three pools:
- Replacement: units replaced at end of life or after failure.
- Capacity addition: units required for new lines, plants or expanded throughput.
- Performance upgrade: units installed to improve quality, energy use, safety or automation.
These pools behave differently. Replacement demand is tied to installed base and asset condition. Capacity demand follows project financing and commissioning schedules. Upgrade demand depends on the payback from lower operating costs or higher output.
The basic calculation is:
Annual product demand = replacement units + units for new capacity + upgrade units − refurbished or deferred purchases.
That estimate should be built from an installed-base model, not simply by applying an industry growth rate to current sales.
Purchase criteria reveal the reachable market
The order of purchase criteria can change the competitive set. If buyers prioritize lowest purchase price, local distributors and imported products may dominate. If failure creates expensive downtime, service response and reliability can outweigh initial price. If an item must integrate into a certified process, qualification history may be a stronger barrier than brand awareness.
We would test criteria with buyers and distributors, then score each segment on:
- Technical specification and acceptable substitutes.
- Total cost of ownership, including energy and maintenance.
- Qualification process and time to become an approved supplier.
- Typical order size, lead time and replenishment pattern.
- Service expectations and cost of an outage.
Interviews should ask for the last purchase, not just stated preferences. Recent bid comparisons, rejection reasons, maintenance records and reorder intervals are more informative than asking buyers what they might purchase in the future.
Replacement cycles need a range, not a single number
Useful life varies with duty cycle, environment, maintenance quality and product design. A component operating continuously in a corrosive process can have a different replacement pattern from one used intermittently in a controlled plant. Model normal replacement, early failure and life-extension through repair separately.
The resulting opportunity is the volume a supplier can actually reach after accounting for locked-in contracts, approved-vendor lists, local stock, technical support and competitor coverage. This is where a Industrial product demand assessment becomes a sales plan: it identifies the segment, trigger and capability needed to win.
Framework: Application-to-Volume Map
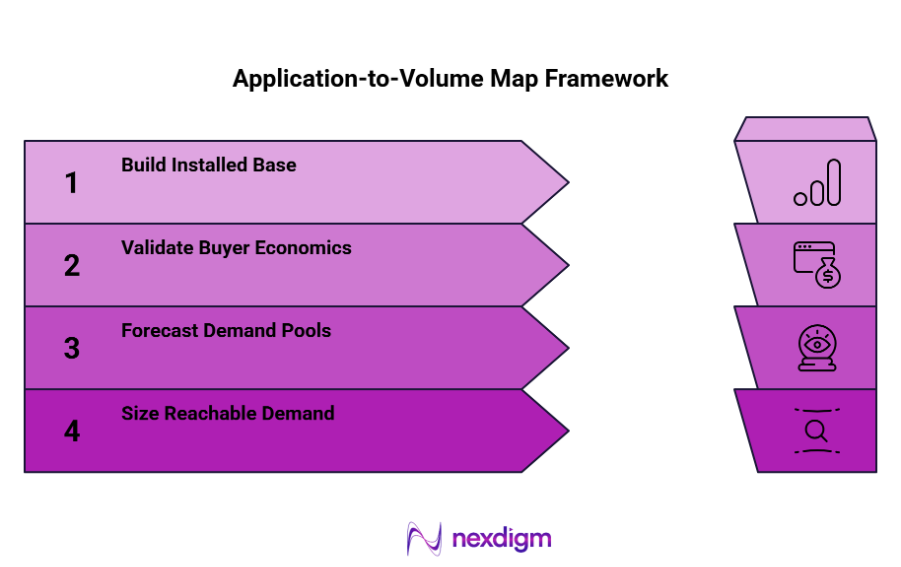
- Define the product and use case
Set product boundaries, configurations, substitutes and plant applications. - Build the installed base
Estimate units in operation by sector, age, duty cycle, geography and operating environment. - Validate buyer economics
Confirm purchase criteria, failure costs, specification requirements and qualification barriers. - Forecast demand pools
Model replacement, capacity additions, upgrades, repair and deferred purchasing. - Size reachable demand
Adjust for contracts, channels, supplier approval, service coverage and realistic share capture.
Nexdigm Case Study
Nexdigm mapped demand for 12 industrial product families across four end-use sectors, combining installed-base estimates with buyer interviews and replacement records. Our analysis found that three segments represented 41% of reachable volume; we recommended prioritizing those applications and adapting service coverage to their purchasing cycles.
To take the next step, simply visit our Request a Consultation page and share your requirements with us.
Harsh Mittal
+91-8422857704