

Manufacturing growth is increasingly concentrated in particular technologies, products and supply chains. Mature industries can continue generating substantial revenue, but emerging demand pools may offer better expansion opportunities where investment, technological change or new customer requirements are creating unmet demand.
A latest manufacturing report recorded a 1.5% quarter-on-quarter increase in global manufacturing production in Q2 2026. Manufacturing exports rose 6.1% during the quarter, while exports of higher-technology goods increased 7.1%.
These figures indicate stronger activity in technology-intensive segments, although quarterly growth alone does not establish long-term market attractiveness.
The more useful question for manufacturers is where demand is expanding faster than capable suppliers can respond. That gap may appear in industrial automation, electrical equipment, specialised components, advanced materials or machinery used to upgrade existing production facilities.
Which Industrial Segments Are Creating New Demand?
Emerging growth pools often develop around changes in the industries that purchase manufactured goods.
- Investment in electricity networks, for example, supports demand for transformers, switchgear, cables and power-control equipment.
- Factory automation creates opportunities for sensors, drives, robotics components and precision parts.
- Data-centre expansion increases requirements for electrical systems, cooling equipment and specialised infrastructure components.
These opportunities differ in their commercial characteristics.
Electrical equipment may benefit from long investment cycles and substantial project backlogs, while specialised components can offer attractive margins but require lengthy customer qualification.
Industrial automation may command premium pricing where it improves productivity, but adoption depends on customers’ capital budgets and integration capabilities.
A useful initial screen separates growth pools by the source of demand:
- Capacity expansion: new factories, industrial parks and production lines require machinery, components and supporting equipment.
- Technology replacement: Automation, electrification and efficiency upgrades create demand for newer products even where total industrial output grows slowly.
- Supply-chain localisation: Manufacturers seek qualified regional suppliers to reduce lead times, improve resilience or meet local-content requirements.
- Regulatory and technical change: Revised safety, emissions, quality or performance standards can accelerate replacement of existing equipment.
These drivers should be assessed alongside actual orders, customer capital expenditure and supplier capacity. Announced projects are useful indicators, but they should not be counted as secured demand until financing, procurement and implementation are sufficiently advanced.
Mature Markets Still Offer Selective Opportunities
A mature industry is not necessarily an unattractive one. Replacement demand, maintenance requirements, aftermarket parts and specialised upgrades can provide stable revenue even when new capacity additions slow.
A manufacturer producing standardised components may face price pressure and excess capacity, while a supplier offering precision parts, shorter lead times or specialised certification may retain stronger margins.
Similarly, demand for industrial machinery can remain modest overall while equipment categories benefit from factory modernisation.
The IEA’s Energy Technology Perspectives 2026 provides a useful warning against treating every emerging manufacturing segment as a growth opportunity.
Investment in manufacturing capacity for six selected clean-energy technologies fell below US$200 billion in 2024, from nearly US$220 billion in 2023, and was estimated to weaken further in 2025.
Excess capacity in solar PV and batteries means that rising technology adoption does not automatically justify more manufacturing investment.
For Industrial sector growth potential analysis, Nexdigm can compare end-market demand, technology adoption, installed capacity and supplier competitiveness to identify which segments offer durable growth rather than temporary momentum.
Where Should Manufacturers Concentrate Investment?
The strongest opportunities tend to combine expanding demand with a clear reason for customers to choose a new supplier. That reason may be lower delivered cost, superior technical performance, local availability, shorter lead times or the ability to meet a specification that existing suppliers cannot reliably satisfy.
Manufacturers should test opportunities against customer purchasing plans, achievable margins, qualification timelines, capacity additions and the cost of building the required capabilities. Growth forecasts should be separated from the portion of demand the business can realistically serve.
Industrial Growth Pool Prioritisation Framework
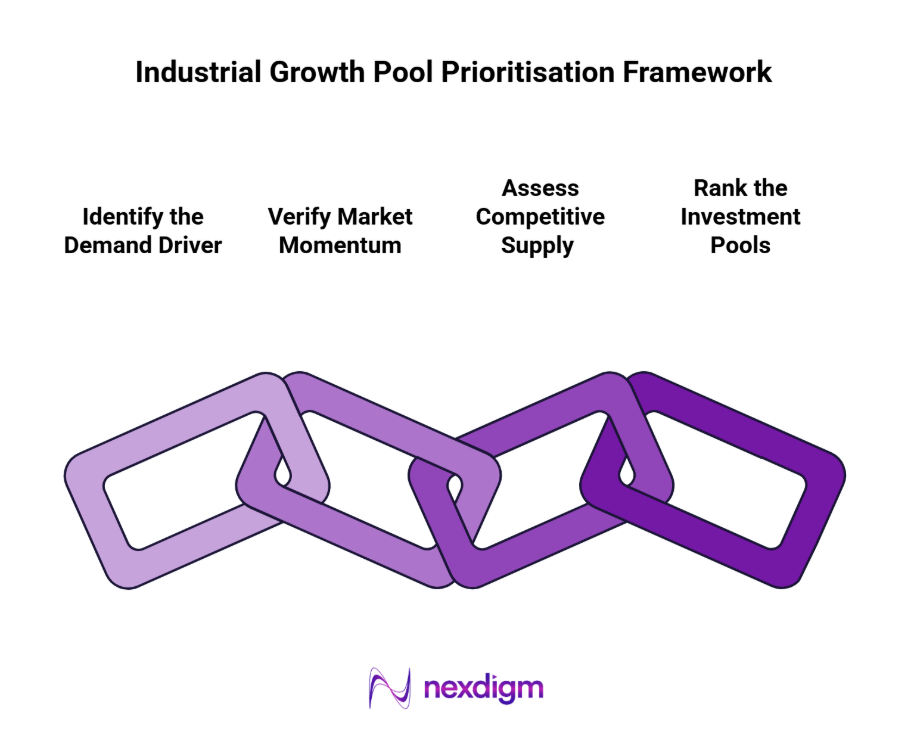
- Identify the Demand Driver
Map changes in industrial investment, technology adoption, regulation and customer requirements to specific product categories. - Verify Market Momentum
Test forecasts against orders, production data, imports, customer capital expenditure and the timing of announced projects. - Assess Competitive Supply
Evaluate incumbent capacity, product differentiation, supplier concentration, qualification barriers and expected pricing pressure. - Rank the Investment Pools
Compare addressable revenue, margin potential, investment requirements and demand resilience to identify the segments worth pursuing.
Nexdigm Case Study: Identifying the Next Growth Pools
Nexdigm assessed 28 industrial product categories for a diversified manufacturer seeking to reduce dependence on mature components. The team mapped demand across five end markets and compared import growth, planned capacity, customer concentration and achievable margins.
Seven categories advanced to detailed assessment; three showed projected annual demand growth of 6% to 9%, with gross-margin potential of 19% to 24%.
To take the next step, simply visit our Request a Consultation page and share your requirements with us.
Harsh Mittal
+91-8422857704