

Last-mile delivery is where a logistics network’s operating model becomes visible in its margins. A parcel may travel efficiently through fulfilment centres and line-haul networks, yet become expensive in the final kilometres because each delivery requires a separate stop, rider time, vehicle capacity and customer interaction. The economics become particularly difficult when order density is low or service expectations require narrow delivery windows.
Parcel demand continues to expand. The International Post Corporation reported average parcel-volume growth of 4.4% across the postal operators it tracks in 2024, following 5.7% growth in 2023. Cross-border e-commerce remained an important contributor to parcel activity, reinforcing the need for networks that can handle both domestic and international flows.
India’s rapid-delivery market shows why density matters. Industry estimates indicate that standard delivery still represented the majority of India’s e-commerce last-mile market in 2025, while same-day delivery was the fastest-growing segment. The distinction is commercially important. Standard delivery allows carriers to consolidate routes and operate with greater flexibility. Same-day and rapid delivery require inventory and delivery capacity to be positioned much closer to the customer.
The economics change sharply with density
A delivery network does not become efficient simply because parcel volumes increase. What matters is how those parcels are distributed.
A dense residential cluster can allow a rider to complete multiple deliveries within a relatively small radius. The same number of orders spread across suburban or peripheral areas can require considerably more rider time and kilometres. The resulting cost difference affects fleet utilisation, delivery productivity and the number of vehicles required during peak periods.
Quick-commerce networks make this relationship particularly visible. By 2026, India’s rapid-delivery infrastructure had expanded to thousands of dark stores across hundreds of cities. Their operating model depends on keeping inventory close enough to customers to compress delivery distances and generate sufficient orders per location. Industry analysis has also highlighted that smaller cities often require wider delivery radii and face lower order density, making the economics materially different from major metropolitan clusters.
The trade-off is between fixed and variable cost. Adding a fulfilment point can shorten delivery distances and improve rider productivity, but it also introduces rent, staffing, inventory and facility costs. The optimal network is therefore rarely the one with either the fewest facilities or the greatest number. It is the one where the combined cost of infrastructure and delivery remains competitive at the required service level.
Faster delivery has to earn its premium
Consumers increasingly expect visibility, predictable delivery windows, easy rescheduling and convenient returns alongside speed. The International Post Corporation’s parcel research tracks these dimensions because delivery experience increasingly influences how customers evaluate logistics providers.
However, every additional service commitment changes the operating model.
A same-day promise may require local inventory positioning, dedicated dispatch capacity and additional peak-hour labour. A two-hour window can create idle capacity when demand is uneven across the day. Returns add another flow that must be collected, processed and transported.
This makes service design as important as route design. A provider serving high-value electronics may justify tighter delivery windows because customers are less price-sensitive. A high-volume, low-value parcel network may need standardised delivery windows and greater route consolidation to protect margins.
The assessment should therefore distinguish between what customers want and what they will pay for.
Where last-mile models become commercially attractive
The strongest opportunities tend to emerge where three conditions overlap: sufficient order density, predictable demand and an appropriate service proposition.
Urban grocery and convenience delivery can support highly localised networks because purchase frequency is high. E-commerce parcels can achieve stronger economics when delivery routes are concentrated by neighbourhood or when carriers can consolidate shipments through collection points. B2B last-mile networks operate differently again, with fewer stops but potentially higher shipment values and more predictable delivery schedules.
The geography of demand is consequently more useful than city-level population alone. A large city can contain both highly attractive delivery clusters and structurally difficult low-density zones.
For last-mile delivery market feasibility study work, the relevant question is therefore whether a proposed network can generate enough productive delivery activity within each operating zone to cover its fixed and variable costs.
The route economics framework
A robust feasibility assessment can test the network through five connected questions:
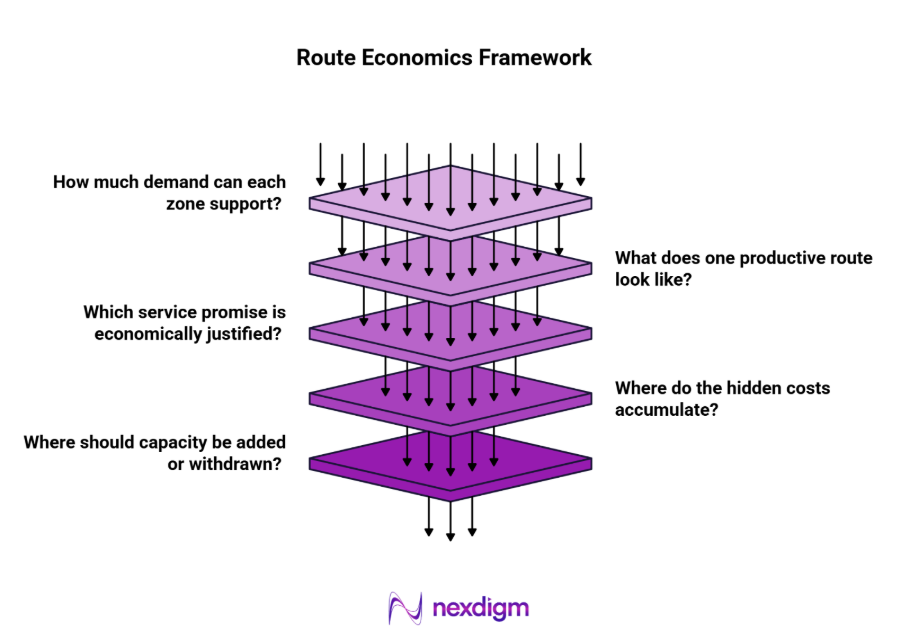
- How much demand can each zone support?
Map orders by postcode, customer type, time of day and frequency. The objective is to identify sustainable delivery density rather than simply total market volume. - What does one productive route look like?
Model stops per route, kilometres per stop, rider hours, vehicle capacity, loading time and successful deliveries. This establishes the physical productivity required to serve each zone. - Which service promise is economically justified?
Compare standard, same-day, scheduled and rapid delivery against willingness to pay, order value and customer retention. Faster service should be evaluated as a commercial product with its own economics. - Where do the hidden costs accumulate?
Include failed deliveries, returns, customer support, rider idle time, peak-period incentives, packaging and reverse logistics. These costs can materially change the apparent profitability of a route. - Where should capacity be added or withdrawn?
Stress-test order growth, seasonal peaks, labour costs and changes in delivery windows. The output should identify which zones warrant new facilities, which require route redesign and which should remain on a broader service model.
This framework enables Nexdigm to assess last-mile feasibility at the level where profitability is actually created: the relationship between demand density, service design and route productivity.
Nexdigm Case: Rebalancing a Multi-City Delivery Network
A consumer-commerce network covering 2.8 million annual orders across 74 delivery clusters was assessed for route density and service profitability. Nineteen clusters generated 63% of contribution profit, while 17 remained structurally loss-making. Rebalancing delivery windows and hub coverage increased estimated contribution margin from 7.8% to 11.6%.
To take the next step, simply visit our Request a Consultation page and share your requirements with us.
Harsh Mittal
+91-8422857704