

A logistics operation can record every shipment, delivery, vehicle movement and warehouse transaction without necessarily knowing where money is being lost.
The volume of operational data is no longer the main constraint. The harder task is converting it into decisions that can change cost, capacity, service levels or risk. That shift is making analytics increasingly important across logistics management.
Supply-chain research found that 98% of respondents reported digital tools improving end-to-end visibility, while 51% were using predictive analytics for ecosystem collaboration. Yet high visibility does not necessarily mean high value realisation.
The First Signal Is Usually an Exception
Most logistics teams do not need another dashboard showing that a shipment is late. They need to know which late shipments require intervention and what that intervention should be.
Analytics can bring together delivery history, carrier performance, route information and customer requirements to identify recurring exceptions. A pattern of missed deliveries on one lane, for example, may point towards a carrier issue, poor route planning or an unrealistic delivery window. This changes the role of data. Instead of describing yesterday’s operation, it starts influencing today’s decisions.
Cost Leakage Often Hides in the Transaction Detail
A logistics budget can look reasonable at an aggregate level while individual activities are quietly eroding margins.
Partial vehicle utilisation repeated expedited shipments, detention charges, inefficient warehouse movements and unnecessary inter-depot transfers are difficult to identify from a single financial line item.
Transaction-level analytics allows these costs to be traced back to specific lanes, SKUs, customers, facilities or operational decisions. The resulting picture is often more useful than a broad comparison of total logistics spends.
For example, analysing 100,000+ logistics transactions in a Nexdigm engagement helped identify ₹43 lakh in revenue leakage across underbilling, other charges, unbilled trips and cost overruns. The exercise showed how granular operational data can expose leakage that conventional reporting can miss.
Prediction Changes the Planning Horizon
Historical reporting answers what happened. Predictive analytics allows logistics teams to work further ahead. Demand signals can inform inventory positioning. Shipment data can highlight potential delays. Vehicle information can indicate maintenance requirements before a breakdown. Carrier performance can help identify lanes where service deterioration is likely.
The value depends on whether the prediction arrives early enough to change the outcome. A model that identifies a likely stockout after replenishment lead time has already passed has little operational value.
The Data Needs to Reach the Decision
A logistics analytics programme can fail even when the underlying model is technically sound. Data may sit across ERP systems, transport platforms, warehouse applications, carrier portals and spreadsheets. Definitions may differ between functions. Some events may only be recorded after the physical activity has occurred.
Connecting these sources is therefore part of the analytical problem. The objective is to create a reliable chain from operational event to insight to action. This is particularly important as companies move from descriptive dashboards towards predictive and prescriptive analytics.
Demand Is Moving Beyond Reporting
Enterprise demand for logistics analytics is increasingly tied to specific decisions rather than generic business intelligence.
Real-time planning, exception management, cost-to-serve analysis, predictive scenario planning and network optimisation each address a different commercial requirement. Their attractiveness also varies by industry, logistics complexity and data maturity.
That creates an assessment question for technology providers and logistics organisations alike: where is the strongest demand, which use cases are buyers willing to fund, and what level of analytical maturity is required to deliver them?
Nexdigm’s Framework for Turning Logistics Data Into Decisions
Nexdigm’s logistics data analytics market demand assessment can evaluate the opportunity through five dimensions:
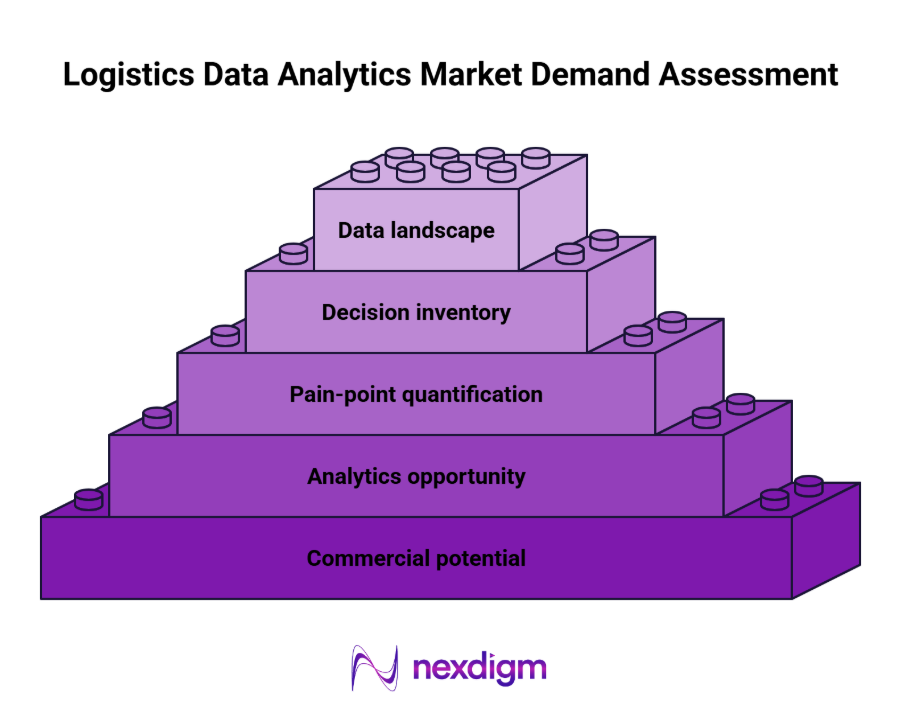
- Data landscape: Map operational data sources, availability, quality and granularity across the logistics network.
- Decision inventory: Identify high-value decisions across planning, transport, warehousing, inventory and customer fulfilment.
- Pain-point quantification: Measure cost leakage, service failures, capacity constraints and operational variability.
- Analytics opportunity: Assess demand for descriptive, predictive and prescriptive analytics across priority processes.
- Commercial potential: Evaluate market demand, buyer priorities, adoption maturity and the value proposition for each opportunity.
The assessment can help technology providers identify where demand is strongest while helping logistics organisations determine which analytical capabilities deserve investment.
A Data Diagnostic That Found ₹43 Lakh in Leakage
For a French logistics company operating more than 90 warehouses across 30+ locations and generating ₹1.65 billion in revenue, Nexdigm reviewed over 100,000 transactions. The analysis identified ₹43 lakh in leakage, including ₹7 lakh in underbilling, ₹6 lakh in other charges, ₹5 lakh in unbilled trips and ₹11 lakh in cost overruns.
To take the next step, simply visit our Request a Consultation page and share your requirements with us.
Harsh Mittal
+91-8422857704