
Freight operations generate a continuous stream of information: shipment records, carrier invoices, delivery timestamps, fuel expenses, route details, warehouse movements and proof-of-delivery reports. Yet having this data does not automatically improve logistics performance. The real advantage comes from connecting these records to identify cost leakages, explain delays and support better operational decisions.
For manufacturers, distributors, importers and exporters, logistics analytics can turn fragmented freight information into a clearer view of how goods move, what each shipment costs and where service reliability breaks down.
Why Freight Data Needs Context
A freight invoice may show that transportation costs have increased, but it rarely explains the underlying cause. The increase could reflect longer routes, lower vehicle utilisation, seasonal demand, fuel surcharges, additional handling or repeated delivery attempts.
These factors require analysis across multiple datasets. Connecting shipment volumes with route distance, vehicle capacity, carrier performance and delivery outcomes helps businesses distinguish between unavoidable cost increases and operational inefficiencies.
The World Bank’s Logistics Performance Indicators 2.0, introduced in its 2025 report, use shipment-level tracking data to assess international supply chain connectivity, speed and reliability. This reflects a broader shift towards measuring actual logistics outcomes rather than relying solely on perceptions or aggregate performance scores.
Businesses can apply the same principle internally by analysing individual shipments and comparing results across routes, facilities, carriers and customer segments.
Turning Operational Records Into Decisions
A useful analytics programme starts with a defined business problem rather than a dashboard full of metrics.
- Freight Cost Analysis: Measure cost per shipment, tonne, kilometre or delivered unit. Compare rates across carriers and routes, accounting for shipment size, service requirements and accessorial charges.
- Delivery Performance Analysis: Track on-time delivery, transit-time variation, missed delivery windows and order fulfilment rates. Average transit time alone can conceal unpredictable delays.
- Route And Capacity Analysis: Compare planned routes with actual movement data, vehicle utilisation, empty running and shipment consolidation opportunities.
- Carrier Performance Analysis: Evaluate service reliability, damage rates, billing accuracy and responsiveness alongside quoted freight rates.
- Exception Analysis: Identify recurring delays, unexpected charges and failed handovers. Prioritise exceptions by financial impact and frequency rather than treating every incident equally.
The goal is to move from describing past performance to identifying the action most likely to improve the next shipment.
Building A Reliable Analytics Foundation
Effective logistics data analytics depends on consistent, connected information. Transportation management systems, warehouse platforms, enterprise resource planning systems, carrier portals and financial records may each describe the same shipment differently.
Shipment identifiers, carrier names, route codes, units of measurement and event timestamps need to be standardised before comparisons become reliable. Missing timestamps or inconsistent definitions of an on-time delivery can distort performance assessments.
Businesses should also separate operational costs from commercial and service-related costs. A carrier offering a lower base rate may generate higher total expenditure through detention, demurrage, storage, re-delivery or premium freight. Evaluating total landed logistics cost provides a more useful comparison than looking at the quoted rate alone.
Data quality should be monitored continuously. Teams need to know which records are incomplete, how exceptions are classified and whether reported savings reflect actual financial outcomes.
From Reporting to Faster Decisions
Analytics creates value when insights reach the people who can act on them. A transport manager needs to know which loads require intervention today. A procurement team needs evidence for carrier negotiations. A supply chain leader needs to understand whether network design, inventory positioning or service commitments require adjustment.
Operational dashboards should therefore distinguish between immediate alerts and longer-term trends. Real-time shipment visibility can support exception management, while historical analysis can reveal persistent bottlenecks and help forecast capacity requirements.
Predictive models may estimate arrival times, identify shipments at risk of delay or anticipate demand surges. However, predictions are only useful when teams have clear response procedures and reliable data. Automation should support decisions, not simply generate more alerts.
The Freight Performance Improvement Framework
A practical approach connects measurement to action through five steps.
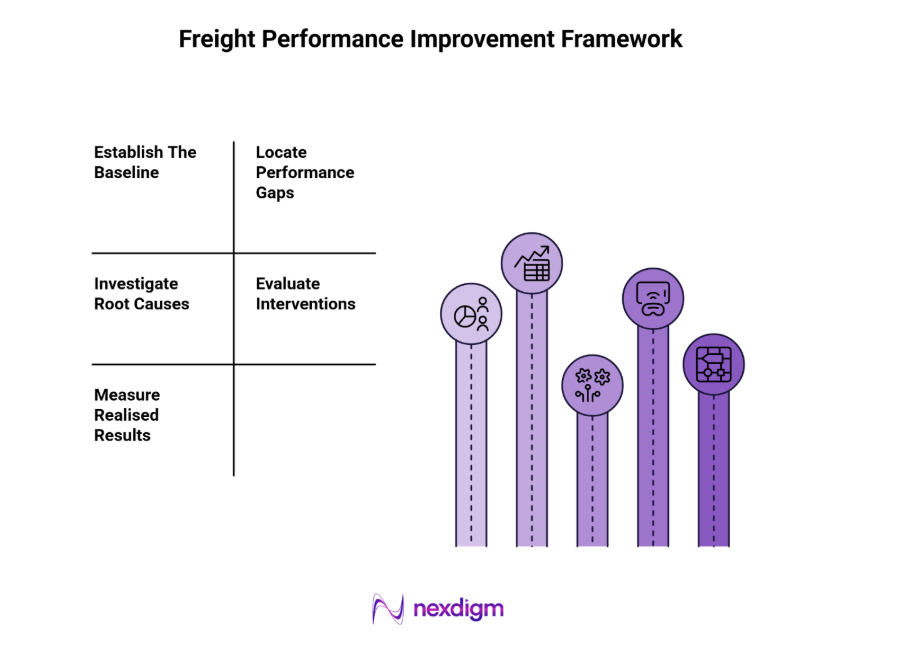
- Establish The Baseline: Measure freight expenditure, delivery reliability, transit-time variation and capacity utilisation.
- Locate Performance Gaps: Compare routes, carriers, facilities and shipment categories to identify unusual costs or delays.
- Investigate Root Causes: Validate whether the gap stems from routing, scheduling, documentation, capacity, carrier performance or data quality.
- Evaluate Interventions: Compare alternatives such as carrier reassignment, shipment consolidation, revised dispatch schedules and route changes.
- Measure Realised Results: Track cost savings, service improvements and unintended effects after implementation.
This sequence prevents businesses from confusing a visible correlation with a proven cause or treating a projected saving as a realised benefit.
Case Study: Reducing Freight Cost Variability
A distributor reviewing 12,000 monthly shipments finds that three regional routes account for a disproportionate share of accessorial charges and late deliveries. Analysis identifies inconsistent dispatch schedules and repeated waiting time. After revising dispatch windows and reviewing carrier agreements, the company tracks changes in cost per shipment and on-time delivery over the following quarter.
Freight analytics is most valuable when it links operational evidence to decisions about cost, capacity and customer service. Businesses that establish consistent metrics, investigate recurring exceptions and measure the results of interventions can improve logistics performance without relying on blanket cost-cutting measures.
To take the next step, simply visit our Request a Consultation page and share your requirements with us.
Harsh Mittal
+91-8422857704