

Logistics expansion is often framed as a question of where to build the next warehouse, hub, or distribution centre. The harder question is whether the existing network is positioned to absorb where demand is moving.
That distinction matters as logistics footprints spread beyond established metropolitan markets. In India, industrial and logistics leasing reached 39.5 million sq. ft. across eight cities in 2024, with 3PL providers accounting for 41% of leasing activity. By H1 2025, industrial and warehousing leasing across eight major cities had reached another record of 27.1 million sq. ft., up 63% year on year.
Expansion decisions therefore need to connect today’s network coverage with tomorrow’s demand rather than simply adding capacity where the company already operates.
Start With What the Existing Network Can Actually Deliver
A network map showing warehouses and hubs does not reveal whether those facilities are serving customers effectively.
The assessment needs to examine shipment volumes, facility utilisation, delivery times, service coverage, transportation costs and customer concentration. A facility operating at 80% capacity in a strategically important market presents a different expansion requirement from one operating at 80% but serving a declining customer base.
The analysis should also identify where the existing footprint creates unnecessary transportation legs, long delivery times or duplicated capacity.
This establishes the baseline before any new locations are considered.
Future Demand Rarely Follows the Existing Footprint
Demand can shift because of new manufacturing capacity, e-commerce penetration, urbanisation, retail expansion or changes in sourcing patterns.
India’s warehousing market illustrates this geographic broadening. Around 100 million sq. ft. of warehousing stock is now located in Tier-II and Tier-III cities, while manufacturing, e-commerce and 3PL activity continues to create demand outside traditional logistics hubs.
For a logistics operator, this means today’s strongest facility may not be the right location for tomorrow’s incremental volume.
Demand forecasting should therefore identify where customers, production and shipments are likely to concentrate over the next three to five years, rather than extrapolating historical facility volumes indefinitely.
The Real Gap Is Between Demand and Service Capacity
Once future demand is mapped, the next step is to compare it with what the network can support.
A market may appear adequately covered geographically while still experiencing a service gap because of insufficient storage, poor transportation connectivity or limited last-mile capacity.
The assessment should consider:
- projected shipment volumes versus facility capacity
- delivery-time requirements by customer segment
- warehouse and transport utilisation
- distance to major demand clusters
- availability of alternative facilities
- inbound and outbound freight costs
- peak-period capacity requirements
This helps distinguish a genuine network gap from a temporary utilisation problem.
Expansion Does Not Always Mean Building Another Large Hub
There are several ways to close a coverage gap. A company could build a greenfield distribution centre, expand an existing facility, establish a smaller satellite hub, use a third-party warehouse, add micro-fulfilment capacity or partner with another logistics provider.
The right answer depends on the density and predictability of demand.
A large facility may provide better unit economics when volumes are concentrated. Smaller facilities may make more sense where demand is geographically dispersed or still developing. Partnerships can also reduce capital exposure when the market opportunity has not yet been fully validated.
The comparison therefore needs to measure the incremental demand served against the investment required.
Expansion Should Follow the Economics of the Network
Location alone does not determine whether a new facility creates value.
A new hub can reduce delivery distances while increasing fixed costs. It can improve service levels while leaving the facility underutilised. It can also shift freight between nodes without materially reducing total network cost.
A proper logistics network expansion assessment therefore needs to model the network as an integrated system. The question is not simply which location scores highest, but which combination of facilities produces the strongest balance of coverage, utilisation, service and cost.
Nexdigm’s Framework for Building a Network Expansion Case
Nexdigm evaluates network expansion by connecting current operating performance with projected demand and investment economics.
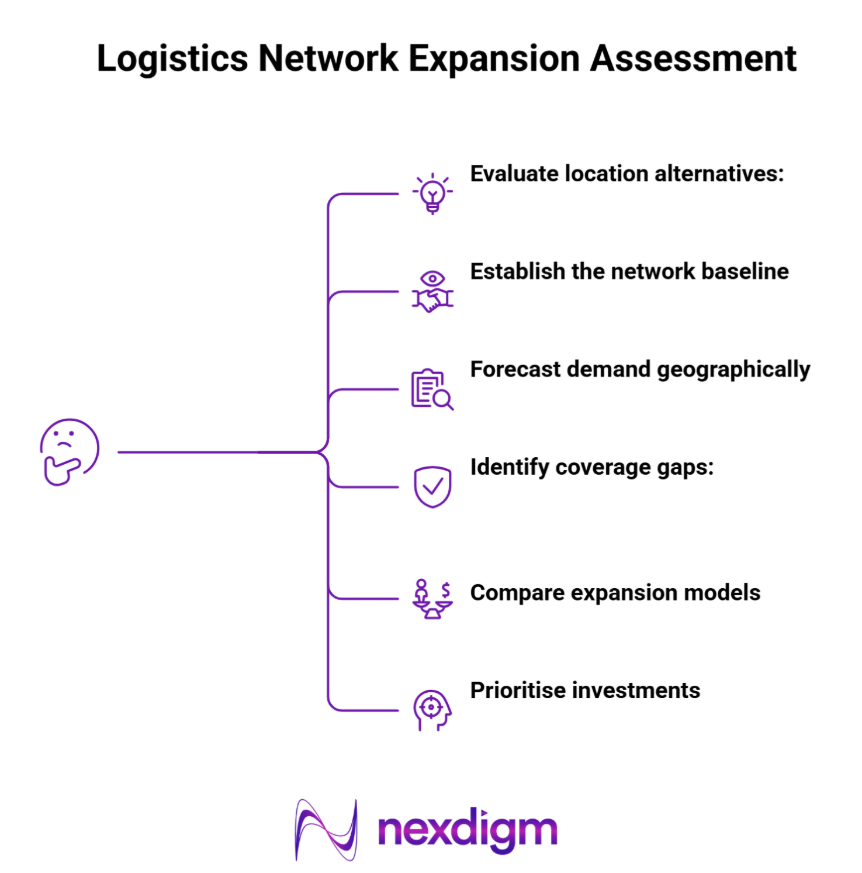
- Establish the network baseline: Map facilities, shipment flows, utilisation, service levels, customer locations and transportation costs to identify where the current footprint performs well and where it creates friction.
- Forecast demand geographically: Segment future demand by customer, industry, geography and shipment profile, incorporating manufacturing expansion, consumption growth, e-commerce and emerging logistics corridors.
- Identify coverage gaps: Compare projected demand with available capacity and service requirements to determine where additional infrastructure will actually be needed.
- Evaluate location alternatives: Score potential locations based on demand proximity, connectivity, labour, real-estate economics, transportation access and competitive intensity.
- Compare expansion models: Model greenfield facilities, expansions, satellite hubs, 3PL partnerships and other options against capex, opex, utilisation and service outcomes.
- Prioritise investments: Build scenarios showing which facilities should be added first, what demand they will capture, when capacity will be required and how the network economics change.
How Nexdigm Turned Network Gaps into Expansion Priorities
A 3PL operating across 18 facilities expected shipment volumes to increase 32% over three years but initially planned four new warehouses. Nexdigm modelled customer demand, facility utilisation and transport flows and found that only two locations required new capacity. Rebalancing inventory and adding satellite facilities in two other markets reduced projected expansion capex by 19% while improving average delivery coverage.
To take the next step, simply visit our Request a Consultation page and share your requirements with us.
Harsh Mittal
+91-8422857704