

Manufacturing demand is rarely driven by one macroeconomic number.
Factories increase output when customers order more products, when downstream industries expand capacity, when inventories need replenishment, or when investment in new technologies creates entirely new production requirements.
That makes manufacturing demand a combination of end-market growth and industrial utilization.
The latest global data shows a modest but broad-based improvement. UNIDO reported that global manufacturing production increased 1.2% quarter-on-quarter in Q1 2026, following subdued growth during 2025. Manufacturing exports rose 3.5%, while higher-technology production increased 1.9% and higher-technology exports grew 4.7%.
The numbers are useful, but the underlying demand drivers differ substantially by industry.
End-Use Growth Creates the First Layer of Demand
Manufacturing demand ultimately begins with what customers purchase.
Automotive production creates demand for metals, components, electronics, plastics, machinery, and industrial services. Construction creates demand for cement, steel, glass, machinery, and building products. Electronics creates demand for semiconductors, displays, batteries, precision components, and specialised equipment.
The demand chain therefore runs from final consumption to industrial production.
A market assessment needs to trace this chain rather than assuming that overall GDP growth will translate proportionally into factory output.
The IMF projects global growth of 3.0% in 2026 and 3.4% in 2027, but the outlook remains uneven across economies and sectors.
Capacity Utilization Determines When Demand Becomes Investment
Rising orders do not immediately produce new factories.
Manufacturers often respond to demand increases by using existing capacity more intensively, adding shifts, improving throughput, or reducing downtime.
New capital expenditure becomes more likely when utilization approaches practical limits.
The US Federal Reserve reported manufacturing capacity utilization at 75.7% in August 2026, below its long-run average of 78.2%. Total industrial capacity utilization stood at 76.3%.
This distinction matters.
A market can grow while companies still have enough spare capacity to meet additional demand. Another market with similar growth can require immediate investment if its installed base is already heavily utilized.
For equipment suppliers, raw-material producers, and industrial investors, utilization is therefore an important leading indicator.
Technology Investment Is Creating New Demand Pools
Some manufacturing demand is being created by technologies that did not previously require large industrial capacity.
AI infrastructure is a prominent example.
Data-centre investment is increasing demand for semiconductors, servers, power equipment, cooling systems, electrical infrastructure, and construction materials.
Semiconductor manufacturing equipment illustrates the effect. SEMI forecasts global semiconductor manufacturing equipment sales of $165.9 billion in 2026, up 23.2% from 2025, with AI infrastructure, advanced memory, leading-edge logic, and advanced packaging contributing to the investment cycle.
This creates a second layer of manufacturing demand: production generated by technological investment itself.
Trade and Supply-Chain Strategy Are Also Creating Capacity
Manufacturing investment is increasingly influenced by supply-chain restructuring.
UNCTAD reported that strategic sectors accounted for 44% of global greenfield project values in 2025, compared with only 16% in 2020.
This suggests that manufacturing investment is increasingly concentrated around sectors considered strategically important, including technology, energy, infrastructure, and supply-chain-sensitive industries.
The demand effect can be significant.
A new semiconductor facility creates demand for semiconductor equipment, chemicals, cleanroom systems, utilities, engineering services, and logistics. A new battery plant creates demand for materials, production machinery, automation, testing, and packaging.
One factory investment can therefore generate multiple layers of industrial demand.
Inventory Cycles Can Distort the Signal
Manufacturing demand is also affected by inventories.
When companies hold excess inventory, new orders can weaken even if end-user demand remains stable. When inventories become depleted, manufacturers can experience a rapid order recovery without a corresponding increase in final consumption.
This makes order data difficult to interpret in isolation.
A durable demand assessment should compare production, new orders, inventory levels, utilization, imports, exports, and downstream consumption.
That allows analysts to distinguish a genuine expansion cycle from temporary inventory adjustment.
Nexdigm’s Manufacturing Demand Assessment Framework
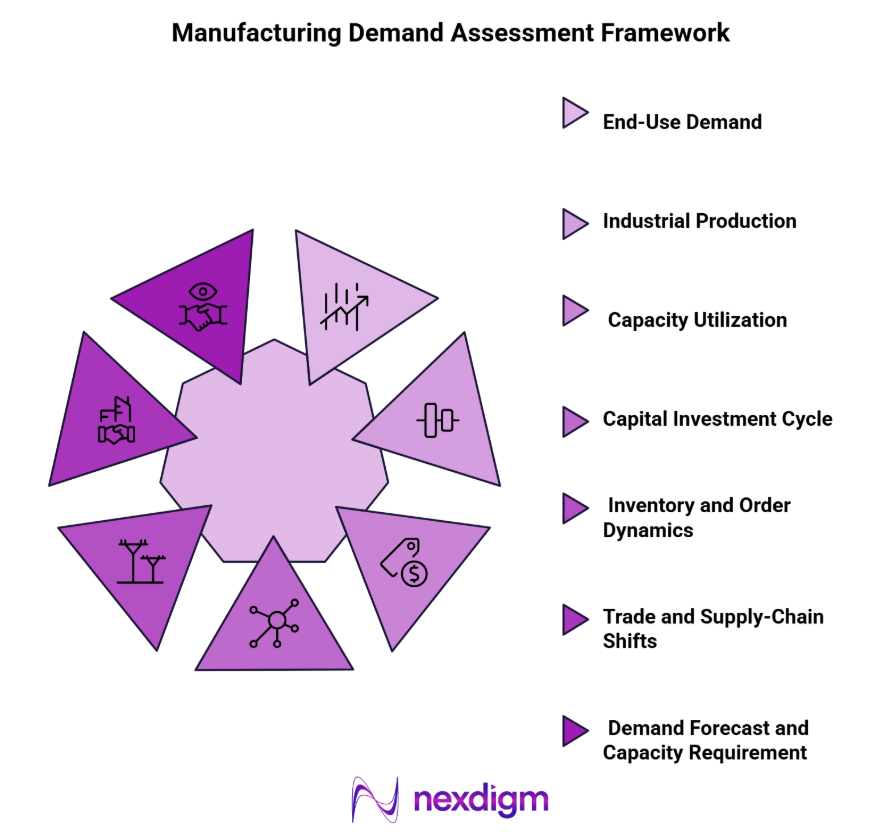
- End-Use Demand
Track consumption and production across automotive, construction, electronics, energy, healthcare, consumer goods, and other downstream sectors. - Industrial Production
Measure factory output growth by industry, product category, geography, and technology intensity. - Capacity Utilization
Assess installed capacity, current utilization, practical operating limits, and the point at which expansion becomes economically necessary. - Capital Investment Cycle
Track factory announcements, equipment orders, project pipelines, technology investment, and capacity additions. - Inventory and Order Dynamics
Separate final demand from inventory rebuilding, destocking, new orders, backlog, and export demand. - Trade and Supply-Chain Shifts
Assess import substitution, export opportunities, reshoring, localization, tariffs, and regional supply-chain restructuring. - Demand Forecast and Capacity Requirement
Translate end-market growth and utilization into future production requirements, equipment demand, and potential capacity additions.
Case Study: Manufacturing Demand Assessment
Global manufacturing production increased 1.2% in Q1 2026, while higher-technology manufacturing grew 1.9% and manufacturing exports increased 3.5%. Mapping production growth against utilization, investment cycles, and downstream demand can identify industries approaching future capacity requirements.
Nexdigm can support manufacturing demand assessment services through end-use analysis, capacity mapping, utilization assessment, investment tracking, demand forecasting, and market opportunity evaluation.
To take the next step, simply visit our Request a Consultation page and share your requirements with us.
Harsh Mittal
+91-8422857704