

A manufacturer’s demand forecast can go wrong even when the market data is accurate. Orders describe buying intent, production shows what factories are making, and inventory reveals whether output is moving through the system. These measures can diverge for months.
In August 2026, U.S. factory orders rose 0.1% to USD 663.5 billion. Unfilled orders increased 0.6% to USD 1.61 trillion, while shipments were nearly unchanged. A growing backlog may support future production, but the signal needs qualification: orders can be delayed, canceled or concentrated in a few industries, and dollar values can rise because of price changes rather than higher unit demand.
Global manufacturing production grew 1.5% in Q2 2026, but export growth was stronger at 6.1%. That spread can reflect inventory movement, pricing or trade patterns as well as physical output. A forecast should reconcile these signals before converting them into product requirements.
Build the forecast from customer production
Start with the manufacturing demand forecast analysis that drives your customer’s production. Then translate planned output into the inputs, components or equipment your business supplies. The chain is:
End-market demand → customer production → product intensity per unit → orders → shipments.
For each major customer or segment, collect the variables that change the conversion:
- Production schedule and operating days.
- Product mix and usage per finished unit.
- Scrap, yield and maintenance requirements.
- Inventory target and order cadence.
- Planned line additions, shutdowns or technology changes.
This method catches a common forecasting error: applying a plant-level growth rate to all suppliers even when production mix shifts toward products that use different components or quantities.
Separate trend from timing noise
Orders may be pulled forward ahead of price increases, delayed by inventory corrections or bunched around shutdowns. A good forecast labels these effects instead of treating every monthly change as a trend.
Use a base case, an upside case and a downside case. The scenarios should differ on a small number of drivers that matter commercially, such as customer output, utilization, inventory reduction, project timing or export demand. Then report ranges by month or quarter, not only a single annual total.
For short-cycle products, weekly customer bookings and distributor inventory may be leading indicators. For capital goods, project approvals, construction progress and equipment orders can lead shipments by several quarters. The right indicators depend on the order-to-delivery lag of each product line.
Turn forecast accuracy into operating value
Measure errors by customer, product family and lead time. A forecast can be accurate in aggregate while systematically missing high-margin products or failing to anticipate a major customer’s production shift.
Track bias as well as accuracy. Persistent overforecasting creates excess inventory; underforecasting can cause missed orders and expedited freight. Update assumptions when backlogs, customer schedules, inventory ratios or lead times cross agreed thresholds, rather than revising the plan after every data point.
Framework: Signal-to-Requirement Forecast
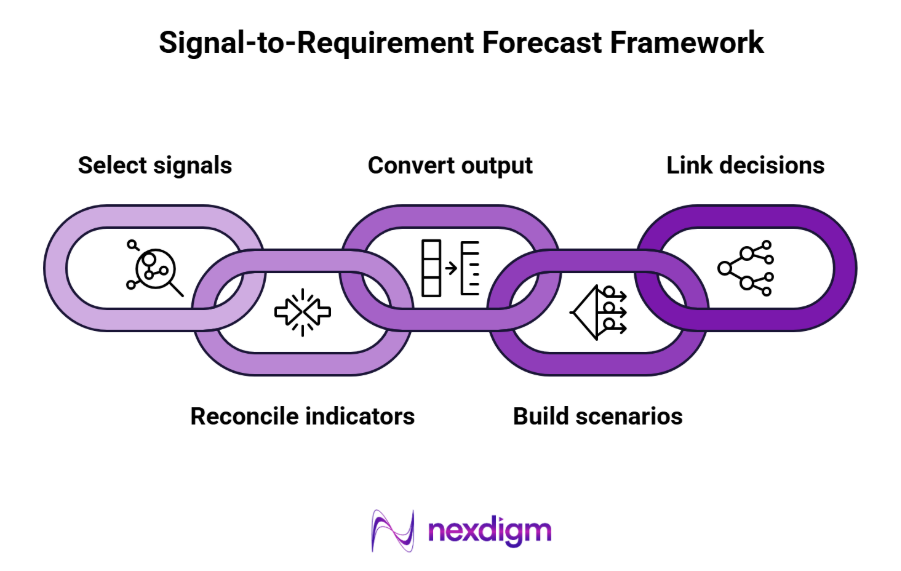
- Select demand signals
Combine end-market output, customer orders, backlog, shipments, inventory and trade data. - Reconcile the indicators
Separate price effects, order timing, cancellations, inventory swings and changes in product mix. - Convert output to requirements
Apply customer-specific usage rates, yields, maintenance factors and operating schedules. - Build scenarios and ranges
Stress-test customer production, utilization, project timing, inventories and export exposure. - Link the forecast to decisions
Translate ranges into procurement, production, stock, capacity and account actions; track forecast bias.
Nexdigm Case Study
Nexdigm developed a 24-month forecast for a component supplier across six customer sectors, reconciling production plans with orders, backlog and inventory. The model reduced forecast error by 18% and supported a shift in stock toward two sectors with stronger confirmed schedules.
To take the next step, simply visit our Request a Consultation page and share your requirements with us.
Harsh Mittal
+91-8422857704