

Manufacturing competitiveness is often discussed in terms of factory productivity, technology and labour costs. International trade provides another perspective: whether manufacturers can sell their products across borders, maintain demand and compete against suppliers in other production locations.
Export data can reveal which products are gaining international traction, where market shares are changing and which industries are becoming more dependent on imported inputs. Interpreted carefully, these patterns help businesses evaluate competitive strengths and supply-chain vulnerabilities.
Read Export Performance At Product Level
National export growth can conceal significant differences between industries. Machinery, electronics, chemicals, textiles and transport equipment face different demand cycles, production requirements and competitive pressures.
UNIDO’s International Yearbook of Industrial Statistics 2025 reported that manufacturing value added grew by 2.9% globally in 2024. Yet performance varied across industrial groups and economies. This variation makes it important to assess trade at a product and sector level rather than relying solely on national manufacturing growth.
A practical analysis should track:
- Export Growth: Measure changes in product-level exports across multiple periods.
- Destination Mix: Identify markets gaining importance and dependence on individual buyers.
- Market Share: Compare a country’s or company’s exports with total imports in each destination.
- Unit Values: Examine changes in average export value per unit, while accounting for product mix and quality.
- Import Dependence: Identify imported components, materials and machinery needed to sustain production.
These indicators help reveal whether growth reflects expanding demand, stronger competitive positioning or changing prices.
Connect Trade Flows With Production Capability
Export success depends on the ability to produce consistently, meet specifications and deliver on time. Trade data should therefore be interpreted alongside manufacturing output, productivity, investment and capacity utilisation.
For example, rising exports of electrical equipment may reflect improved production capacity, stronger foreign demand or a shift in regional sourcing. The same increase could also be driven by price movements or a change in the composition of goods exported.
manufacturing trade flow intelligence combines product-level trade records with industry data to test these explanations. The United Nations Comtrade database provides official annual and monthly merchandise trade statistics by product and trading partner, making it useful for tracking shifts in destination markets and supplier relationships.
Comparisons require consistent product classifications and time periods. Trade values should also be checked against physical quantities where available, since higher export value does not necessarily mean higher production volume.
Identify Supply-Chain Dependencies
A manufacturer’s export performance may rely on imported raw materials, components or production equipment. Trade-flow analysis can expose dependencies that are not visible in finished-goods exports alone.
Businesses should map key input categories, major supplier countries and changes in import concentration. They should also examine whether alternative suppliers exist and how quickly inputs could be substituted without affecting quality or certification.
This is especially important when production networks cross several borders. A finished product exported to one country may incorporate components sourced from multiple others, leaving manufacturers exposed to disruptions far beyond their immediate supplier base.
Trade analysis can help companies identify these dependencies and evaluate whether sourcing diversification, local production or inventory changes are commercially justified.
Translate Trade Evidence into Strategy
Manufacturers can use trade-flow findings to prioritise export markets, reassess product portfolios, benchmark competitors and identify opportunities for supplier diversification.
The analysis should distinguish between attractive demand and accessible demand. A market may import large volumes of a product but remain difficult to enter because of technical standards, tariffs, distribution requirements or established supplier relationships.
Companies should also investigate whether export gains are sustainable. Growth concentrated in a single customer market or driven by temporary price movements may carry different risks from growth supported by a broader customer base and stronger production capability.
The Manufacturing Trade Competitiveness Framework
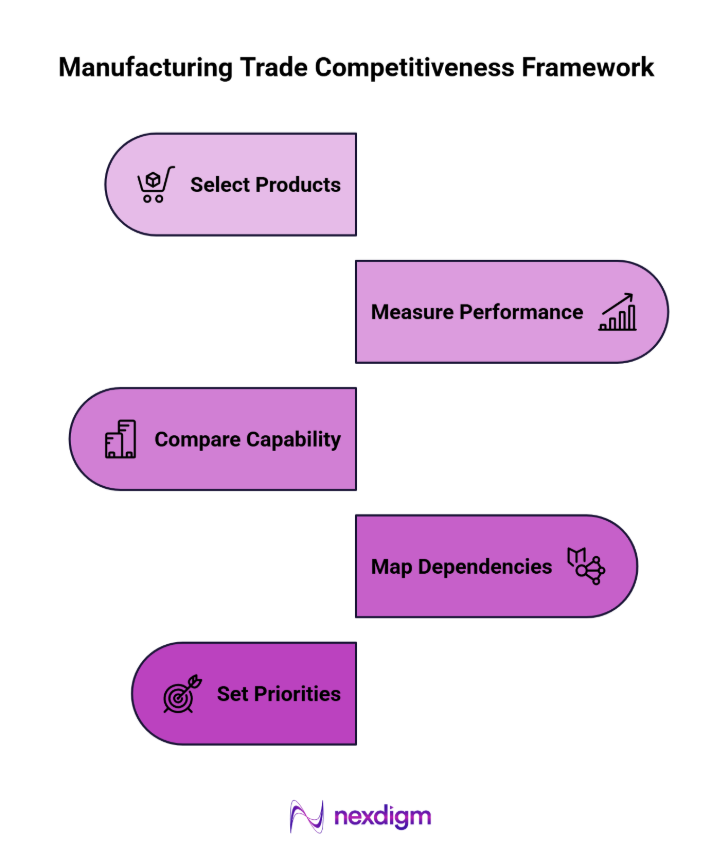
- Select Products and Markets: Define the product categories, export destinations and comparison periods.
- Measure Trade Performance: Track exports, imports, destination growth and market share.
- Compare Production Capability: Review output, productivity, capacity and quality requirements.
- Map Input Dependencies: Identify imported materials, components and concentrated suppliers.
- Set Commercial Priorities: Select markets, products and sourcing changes based on evidence and execution feasibility.
Case Study: Finding An Export Growth Market
A manufacturer of industrial components sees rising exports but remains concentrated in two destinations. Trade analysis identifies another market with growing imports of comparable products and fewer dominant suppliers. The company evaluates technical requirements, distribution costs and product fit before developing a targeted market-entry plan.
Trade flows provide an external test of manufacturing competitiveness. When combined with production and supply-chain data, they help businesses understand where demand is shifting, which dependencies create risk and where capabilities can support sustainable export growth.
To take the next step, simply visit our Request a Consultation page and share your requirements with us.
Harsh Mittal
+91-8422857704