

Midstream growth depends on moving energy from where it is produced to where it is consumed, processed or exported. A region may have rising production yet lack takeaway capacity. Another may have a terminal or storage facility but insufficient contracted throughput to support an expansion. The commercial opportunity sits where a dependable flow meets a binding constraint and a viable way to relieve it.
Shifting Flows Do Not Guarantee Bankable Assets
Recent LNG data illustrate how quickly those flows can change.
The U.S. Energy Information Administration reports that global LNG trade reached a record 56.3 billion cubic feet per day in 2025, up 5.4% from 2024. U.S. LNG exports averaged 17.4 billion cubic feet per day in the first half of 2026, 23% above the same period a year earlier.
At the same time, the IEA’s LNG capacity tracker recorded nearly 46 billion cubic metres per year of new liquefaction capacity reaching final investment decisions between January and October 2026.
These figures signal expanding trade, but they do not establish that every pipeline, terminal or storage project is attractive. New capacity can relieve a bottleneck, compete with existing assets or arrive after market conditions have changed.
A midstream growth opportunity assessment services engagement should therefore connect observed and forecast flows with utilization, capacity, transport economics and firm demand.
Distinguish a Bottleneck From a Bankable Opportunity
- Map Production and Consumption Nodes
Start by mapping production and consumption nodes, including processing plants, power and industrial users, ports and export terminals. Forecast volumes by product and direction, then account for seasonality, contract terms, commodity prices and expected project start dates. - Identify Physical Network Constraints
Next, identify where the network limits those flows. A pipeline may lack capacity during peak periods but have spare capacity for most of the year. Storage may be valuable because of seasonal price differences, inventory requirements or supply interruptions. A terminal expansion may only make sense if upstream supply, shipping and downstream demand can all support the additional throughput. - Evaluate Transport & Capex Alternatives
Transport alternatives matter. Pipeline, rail, truck and marine routes have different costs, capacities and reliability profiles. The best option depends on route length, product characteristics, existing connections and the cost of handling at each transfer point. Interconnection or compression upgrades may address a constraint more economically than building a new line. - Test Commerciality and the Revenue Case
Finally, test the revenue case. Contracted throughput, shipper commitments, tariffs, utilization, construction costs and regulatory approval determine whether a facility can generate reliable returns. A projected supply deficit is not equivalent to a paying customer. Assess who will use the asset, what volumes they can commit and whether the proposed project can compete against existing or planned capacity.
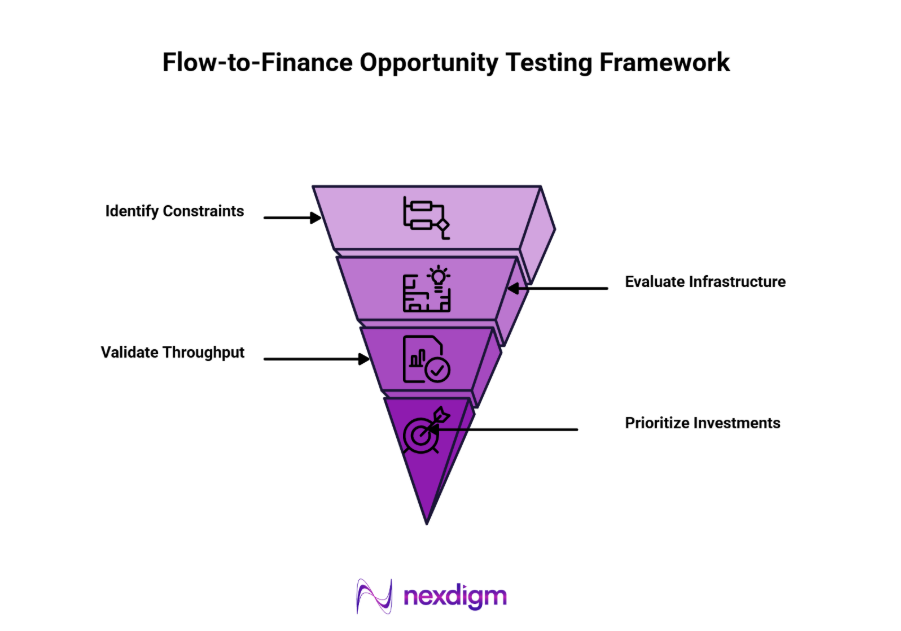
Framework: Flow-to-Finance Opportunity Test
- Map the Market Flow
Identify supply and demand nodes and estimate current and future flows by product, route and season. Separate observed volumes from forecasts and planned projects. - Locate and Measure the Constraint
Compare flow requirements with available pipeline, storage, terminal and transport capacity. Quantify the timing, location and duration of capacity shortfalls, including seasonal or operational constraints. - Compare Infrastructure Responses
Evaluate new capacity against alternatives such as compression, looping, interconnections, storage, reverse-flow capability, rail or marine transport. Compare delivered cost, schedule and reliability. - Validate Throughput and Revenue
Test utilization, customer commitments, tariffs, contract duration, construction cost and regulatory pathway. Stress-test demand, price and schedule assumptions to identify the break-even throughput. - Prioritize the Investable Opportunity
Rank projects by the strength of the constraint, confirmed demand, route-to-market advantage, capital intensity and execution risk. Advance opportunities with identifiable users and bankable volumes; defer those dependent on speculative supply or uncommitted infrastructure.
Nexdigm Case Study
Nexdigm modelled flows across three gas corridors and five demand hubs through 2030. The scenario identified two seasonal constraints where projected peak demand exceeded available transport capacity by 18% and 24%. We recommended testing compression and storage expansions against new pipeline construction, with shipper commitments required before investment.
To take the next step, simply visit our Request a Consultation page and share your requirements with us.
Harsh Mittal
+91-8422857704