

A national oil or gas consumption figure tells investors how large a market is. It does not tell them who is buying, where the demand sits, how stable it is, or whether it can actually be reached. Two markets with similar consumption can therefore present very different commercial opportunities.
One may be driven by freight, aviation and petrochemicals, while another relies heavily on passenger transport and power generation. Gas demand can be concentrated among a handful of large industrial users or distributed across households, commercial customers and city-gas networks. These differences affect everything from infrastructure requirements to pricing power and customer acquisition.
The IEA’s Global Energy Review 2025 noted that road-transport oil demand growth had slowed relative to earlier years, while chemical feedstocks and aviation contributed materially to incremental oil demand in 2024. The shift illustrates why aggregate growth can conceal important changes underneath the total. A market may appear broadly flat while individual demand pools are expanding rapidly.
Rebuild the Market Around Actual Consumption
The most useful demand assessment begins by taking the national total apart.
For oil, consumption should be separated into gasoline, diesel, jet fuel, LPG, naphtha, fuel oil and other products, while distinguishing energy use from petrochemical feedstock demand. Gas requires a different segmentation, covering power generation, industry, fertiliser, city gas, commercial users and households.
Each segment should then be connected to an observable physical driver. Road-fuel demand can be linked to vehicle-kilometres and fleet composition. Aviation follows passenger and cargo traffic, aircraft utilisation and route activity. Industrial gas demand reflects production volumes and process requirements. Household gas consumption depends on connections, appliance penetration and affordability.
Where direct consumption data are incomplete, apparent demand can be reconstructed from domestic production, imports, exports and stock changes. Any residual should remain visible rather than being quietly treated as actual consumption.
This approach produces a demand pool that can be tested rather than simply forecast.
Geography Changes the Commercial Opportunity
Demand is rarely distributed evenly across a country. Oil consumption can cluster around major cities, ports, transport corridors and refinery locations. Gas demand may concentrate around industrial zones, fertiliser complexes, power plants or pipeline-connected urban markets.
Mapping these clusters changes the investment question. A large industrial customer with reliable payment capacity may represent a more attractive opportunity than thousands of dispersed consumers. A city-gas market may have strong long-term potential but require significant network investment before demand becomes accessible. A power plant may consume large volumes while remaining highly sensitive to fuel prices and dispatch economics.
Customer segmentation should therefore include willingness to pay, contract potential, fuel-switching ability, payment quality and infrastructure access. Exchange rates and regulated tariffs can also materially affect imported fuel demand.
The result is a distinction between demand that exists on paper and demand that a supplier or investor can realistically capture.
Forecast the Drivers, Then Test Substitution
GDP can provide a useful macroeconomic reference, but it is rarely sufficient as the primary demand driver.
Forecast vehicle-kilometres, freight tonne-kilometres, industrial production, aircraft activity, household connections and power dispatch according to the relevant market. Then layer in substitution from electric vehicles, rail, renewables, biofuels, coal, pipeline gas or LPG.
The timing of substitution matters. Announced targets do not immediately reduce fuel consumption. The installed vehicle fleet, utilisation rates, charging availability and replacement cycles determine when technology changes begin affecting actual demand.
Scenario analysis should therefore distinguish between gradual adoption and faster structural change. This allows investors to identify segments that remain resilient even when substitution accelerates.
Oil and Gas Demand Opportunity Framework
A demand market can be reconstructed through four commercial lenses:
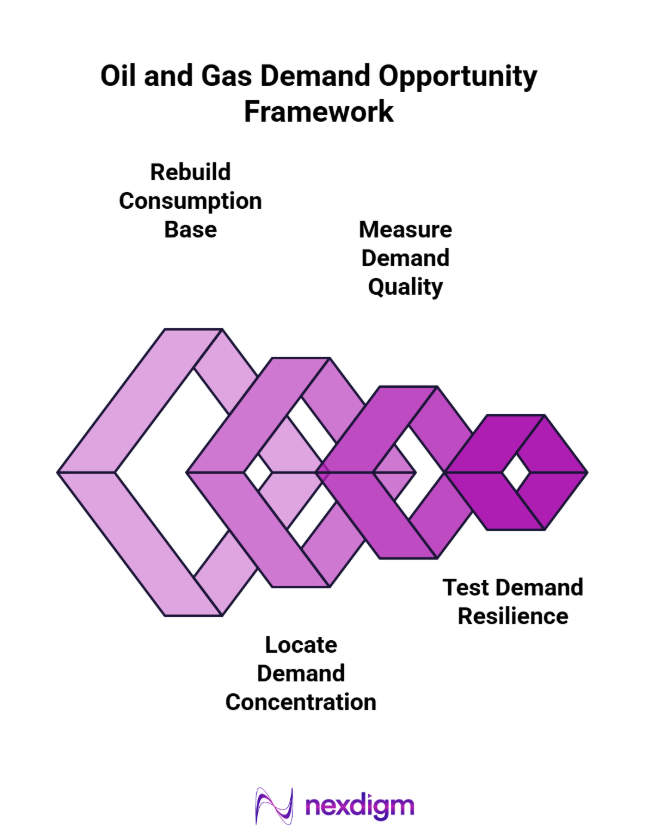
- Rebuild the Consumption Base
Separate oil and gas demand by product, end use and customer type, then reconcile official balances with physical activity and sales indicators. - Locate the Demand Concentration
Map major consumption clusters, industrial customers, transport corridors, ports, cities and pipeline-connected regions to identify where demand is commercially reachable. - Measure Demand Quality
Assess growth, customer concentration, willingness to pay, contract potential, fuel-switching capability and infrastructure dependence across each segment. - Test Demand Resilience
Model efficiency, electrification, alternative fuels, price changes and policy shifts to determine which demand pools can remain commercially relevant.
For oil and gas demand assessment services, Nexdigm can combine energy balances with customer, geographic and activity-level evidence to identify the segments where demand is both durable and commercially accessible.
Nexdigm Case Study
Nexdigm reconstructed oil and gas demand across 6 end-use segments and 4 regions for a market-entry assessment. Sales data, energy balances and physical activity indicators showed aviation and industrial gas as the fastest-growing pools, while passenger gasoline approached a plateau. The client redirected commercial focus toward airport fuel supply and two pipeline-connected industrial clusters.
To take the next step, simply visit our Request a Consultation page and share your requirements with us.
Harsh Mittal
+91-8422857704