

Oil and gas export opportunities are shaped by more than production capacity. Exporters must understand where demand is growing, which buyers are changing suppliers, how trade routes are evolving and whether competing producers can deliver at more attractive prices. For producers, traders and energy investors, these factors determine where additional supply can find a commercially viable market.
Trade intelligence connects export volumes, destination markets, pricing conditions and infrastructure developments to reveal where competitive opportunities are emerging.
Identify The Export Hubs Gaining Momentum
The first step is to distinguish established export centres from markets gaining importance through new production, processing or transportation capacity.
The International Energy Agency’s Oil 2025 report examines how upstream projects, refining capacity, natural gas liquids production and changing demand could reshape oil trade through 2030. For natural gas, its Gas 2025 report identifies a major expansion of liquefied natural gas (LNG) capacity, particularly in the United States and Qatar.
These developments create opportunities, but announced capacity should not be confused with actual export growth. Market assessments should compare production, operational capacity, export volumes and project timelines.
Key indicators include:
- Export Volume Growth: Track crude oil, refined petroleum products, pipeline gas and LNG separately.
- New Export Capacity: Monitor liquefaction terminals, pipelines, export terminals and refinery expansions.
- Destination Diversification: Identify exporters reducing dependence on a limited number of buyers.
- Infrastructure Constraints: Assess whether ports, pipelines, storage facilities and shipping capacity can support additional trade.
This helps distinguish genuine export expansion from projects that remain delayed, underutilised or commercially uncertain.
Map Buyers and Destination Markets
Export growth becomes commercially meaningful when it is matched with sustainable demand. Import data helps identify major buyers, emerging markets and changes in supplier relationships.
OPEC’s Annual Statistical Bulletin 2025 reported that its member countries exported an average of 19.01 million barrels of crude oil per day in 2024, with 71.9% of those exports going to Asia. This concentration demonstrates why Asian demand, refinery requirements and supplier competition remain important considerations for crude exporters.
However, destination analysis should extend beyond headline import volumes. Refinery configurations, fuel specifications, long-term contracts, storage capacity and access to alternative suppliers influence whether a buyer can absorb additional cargoes.
For LNG, contract structure matters as well. Destination flexibility can allow some cargoes to move towards more attractive markets, while fixed-destination commitments may limit a seller’s ability to respond to price differences.
Measure Competitive Position
oil and gas export trends become more useful when export volumes are assessed alongside competitor performance, pricing and delivery reliability.
An exporter may be increasing volumes but losing market share because competitors are expanding faster. Another may retain market share while generating weaker returns due to freight expenses, discounts or less favourable contract terms.
A robust comparison should examine:
- Export growth by product and destination.
- Market share changes across competing suppliers.
- Price differentials and transportation costs.
- Contract commitments and available uncontracted volumes.
- Exposure to sanctions, policy changes and route disruptions.
Commodity prices should also be interpreted carefully. The World Bank’s October 2025 Commodity Markets Outlook anticipated lower energy prices amid ample oil supply and slower demand growth. Such conditions can intensify competition among exporters even when physical trade volumes rise.
Nexdigm’s Energy Export Market Assessment Framework
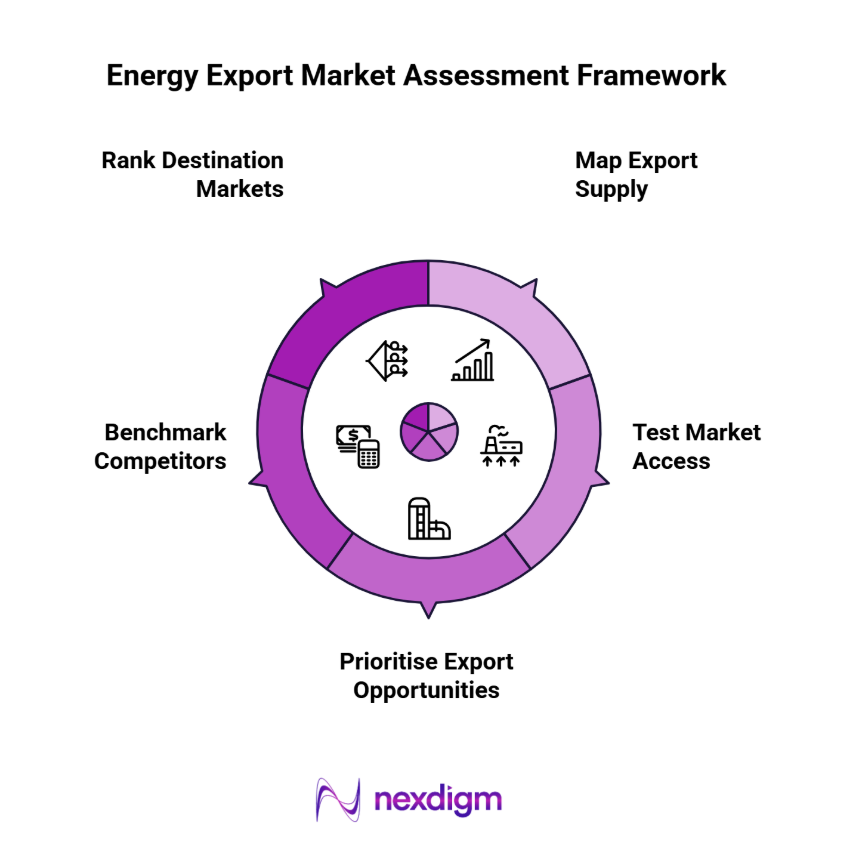
- Map Export Supply: Identify producing countries, operating facilities and upcoming capacity.
- Rank Destination Markets: Measure import growth, buyer concentration and product requirements.
- Benchmark Competitors: Compare market share, export reliability, pricing and delivered costs.
- Test Market Access: Evaluate contracts, infrastructure, regulatory requirements and route exposure.
- Prioritise Export Opportunities: Rank destinations by achievable demand, expected margins and execution risk.
Nexdigm’s Case Study: Evaluating A New Export Destination
An energy producer compares three destination markets for additional refined petroleum exports. One offers higher demand growth but expensive freight, while another has stable demand and established terminal access. The producer prioritises the second market after comparing delivered costs, buyer concentration and contract potential.
Export intelligence helps energy businesses identify markets where supply growth, buyer requirements and competitive positioning align. Regularly monitoring trade flows and destination-level market share allows companies to reassess priorities as infrastructure, demand and commercial conditions change.
To take the next step, simply visit our Request a Consultation page and share your requirements with us.
Harsh Mittal
+91-8422857704