

Oil and gas markets are undergoing rapid changes in supply availability, demand, trade routes, and market access. The IEA’s October 2026 outlook estimates global oil supply reached 102.3 million barrels per day in September, up 2.5 million barrels per day month-on-month, while global oil demand is forecast to decline by 2.6 million barrels per day in 2026. Global observed oil inventories were 509 million barrels below end-February levels by September. Meanwhile, global diesel exports in September were about 700,000 barrels per day lower year-on-year, reflecting continuing supply disruption.
These developments show why oil and gas import export analysis can provide more than a record of traded volumes. Examining imports, exports, origins, destinations, suppliers, buyers, prices, and trade routes can reveal changing demand, supply dependencies, market access conditions, and potential opportunities across energy markets.
Import Growth Can Signal Changing Market Requirements
Rising imports may indicate stronger domestic consumption, declining local production, refinery requirements, inventory rebuilding, or temporary supply shortages. Falling imports can similarly reflect weaker demand or increased domestic availability. The key is to examine trade movements alongside production, prices, infrastructure, and market conditions rather than treating volume changes as direct evidence of demand.
Export Movements Reveal Shifting Supply Positions
Export patterns can show how producing countries and energy companies are responding to changing market conditions. In September 2026, Gulf crude exports increased by 4.4 million barrels per day to 13.9 million barrels per day, while global diesel exports remained constrained.
- Supply Signals: Track changes in exporter shares, origins, volumes, and trade routes to identify shifts in energy availability.
- Market Access Signals: Compare imports, buyers, infrastructure, pricing, and routes to understand how accessible different energy markets are.
By monitoring export movements alongside importer activity, businesses can identify emerging supply shifts, assess market accessibility, and make more informed sourcing, trading, and investment decisions.
Nexdigm’s View on Shifting Oil and Gas Supply Positions
Understanding changing export patterns requires more than identifying which countries are increasing or decreasing shipments. Nexdigm combines oil and gas import export analysis with supplier intelligence, pricing analysis, competitive intelligence, and supply-chain assessment to:
- Track Emerging Supply Sources: Identify exporters, origins, and suppliers gaining relevance as established energy flows change.
- Assess Supply Relationships: Examine trade routes, buyers, pricing, shipment activity, and supplier participation to understand evolving market connections.
- Identify Commercial Implications: Translate supply shifts into insights for sourcing diversification, market entry, procurement, and competitive positioning.
This enables businesses to understand not only where oil and gas supply is moving, but also how these changes could reshape market access and commercial opportunities.
Why Import-Export Analysis Needs a Broader Market View
Energy trade flows can change for several reasons at once. A rise in imports may reflect stronger consumption, but it could also result from supply disruption or lower domestic production. Similarly, increased exports may reflect additional production, inventory releases, or a temporary change in destination economics.
Nexdigm’s analysis can help businesses distinguish these factors by connecting trade data with market, company, infrastructure, pricing, and competitive intelligence. This creates a more reliable basis for understanding whether a trade movement represents a short-term fluctuation or a meaningful market shift.
Nexdigm’s Oil and Gas Import-Export Assessment Framework
Nexdigm can structure oil and gas import export analysis through five connected steps, moving from trade visibility to strategic interpretation. The steps are as follows:
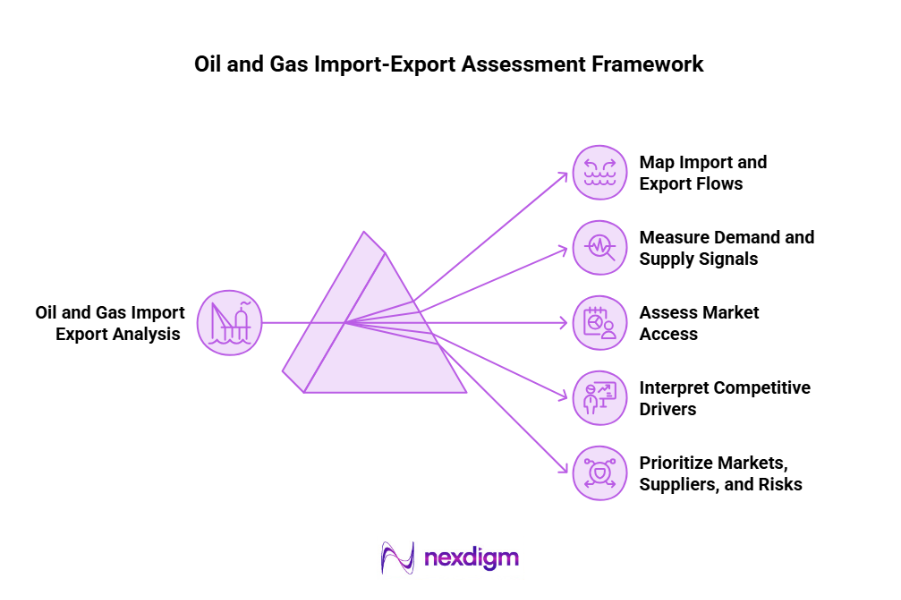
- Map Import and Export Flows: Identify the relevant products, countries, origins, destinations, suppliers, buyers, trade routes, and time periods. This establishes the structure of the market and highlights the major trade relationships.
- Measure Demand and Supply Signals: Analyze import and export volumes, values, growth rates, shipment frequency, supplier shares, buyer participation, and indicative pricing. These indicators help identify where trade activity is increasing, declining, or becoming more concentrated.
- Assess Market Access: Evaluate infrastructure, logistics, transportation routes, import dependence, refinery capacity, supplier availability, pricing, and regulatory conditions. This helps determine whether a market is practically accessible and how easily additional supply can enter.
- Interpret Competitive and Commercial Drivers: Connect trade movements with production, company activity, pricing, competitive positioning, demand conditions, and supply-chain developments. This helps explain why trade patterns are changing and which participants are influencing them.
- Prioritize Markets, Suppliers, and Risks: Rank opportunities according to demand potential, supply availability, market accessibility, pricing, competition, diversification potential, and strategic relevance.
The framework transforms import-export records into a structured understanding of market demand, supply availability, accessibility, competitive positioning, and commercial opportunity.
Nexdigm’s Oil and Gas Trade Intelligence Case
Nexdigm’s trade intelligence approach helped a manufacturer identify market shifts, contributing to 18% export-volume growth, 24% higher distributor orders, and 15% fewer inventory gaps. The analysis supported faster demand forecasting, stronger sourcing decisions, and more informed international market planning.
To take the next step, simply visit our Request a Consultation page and share your requirements with us.
Harsh Mittal
+91-8422857704