

Oil and gas supply chains connect exploration and production sites with processing facilities, pipelines, export terminals, shipping networks, storage infrastructure, refineries and end customers. Each stage introduces dependencies that can affect delivery schedules, costs and supply security.
For energy producers, traders and downstream businesses, the challenge is not simply tracking individual shipments. It is understanding how upstream availability, transportation constraints, contractual commitments and downstream demand interact across the entire network.
Understand The Full Supply Chain
Upstream production data provides only the starting point for assessing supply availability. Crude oil may require blending, treatment or transportation before reaching a refinery. Natural gas may move through pipelines or undergo liquefaction before being shipped internationally.
Visibility requires information from several operational layers:
- Upstream Production: Field output, maintenance schedules, production forecasts and supply interruptions.
- Processing And Storage: Refinery throughput, terminal capacity, inventory levels and product availability.
- Transportation: Pipeline nominations, vessel movements, loading schedules and transit times.
- Commercial Transactions: Contracts, delivery obligations, pricing terms and destination restrictions.
- Downstream Demand: Refinery requirements, power generation, industrial consumption and import demand.
Connecting these layers helps businesses determine whether a supply shortfall originates in production, processing, transportation or changes in demand.
Why Trade And Operational Data Must Be Connected
International trade records can reveal where commodities originate and where they are delivered, but they do not independently explain every operational constraint. Shipment data needs to be interpreted alongside production reports, facility utilisation, inventories and transportation schedules.
The International Energy Agency’s Gas 2025 report describes an LNG market shaped by expanding liquefaction capacity, evolving contract structures and changes in pipeline gas flows. Its analysis highlights why the relationship between physical supply and commercial agreements matters: available production does not necessarily translate into immediately accessible supply for every buyer.
A company analysing LNG procurement, for example, needs to understand not only which exporters have capacity, but also which volumes are contracted, when deliveries are scheduled and whether destination terms allow cargoes to be redirected.
Build Visibility Across Suppliers and Routes
Effective oil and gas supply chain intelligence combines trade flows with supplier relationships, transportation dependencies and market conditions.
Businesses should map critical suppliers, processing locations, storage sites, pipeline connections, ports and destination facilities. This reveals concentration risks, such as dependence on a single export terminal or transportation corridor.
Route analysis should account for both direct and indirect exposure. A disruption at a major maritime chokepoint can affect cargo schedules, freight costs, insurance requirements and the availability of alternative routes. Pipeline networks may offer alternatives in some regions, but spare capacity and destination connectivity can limit their usefulness.
Data should also distinguish between confirmed movements and expected deliveries. Combining scheduled cargoes with historical delays and current infrastructure constraints can help identify where supply interruptions are most likely to affect downstream operations.
Turn Visibility Into Supply Decisions
A supply chain dashboard is useful only if it supports clear operational responses. Procurement teams need to identify alternative suppliers and assess contractual flexibility. Logistics teams need to monitor shipment milestones and prepare contingency routes. Commercial teams need to understand how delays could affect delivery obligations and margins.
Companies can establish alerts for unusual production changes, missed loading windows, declining inventories and delayed arrivals. Scenario analysis can then estimate the effects of disruptions on supply availability, cost and customer commitments.
Data ownership is equally important. Production, trading, logistics and procurement teams should use consistent commodity definitions, shipment identifiers and reporting periods. Without this alignment, different teams may draw conflicting conclusions from the same event.
Nexdigm’s Oil And Gas Supply Visibility Framework
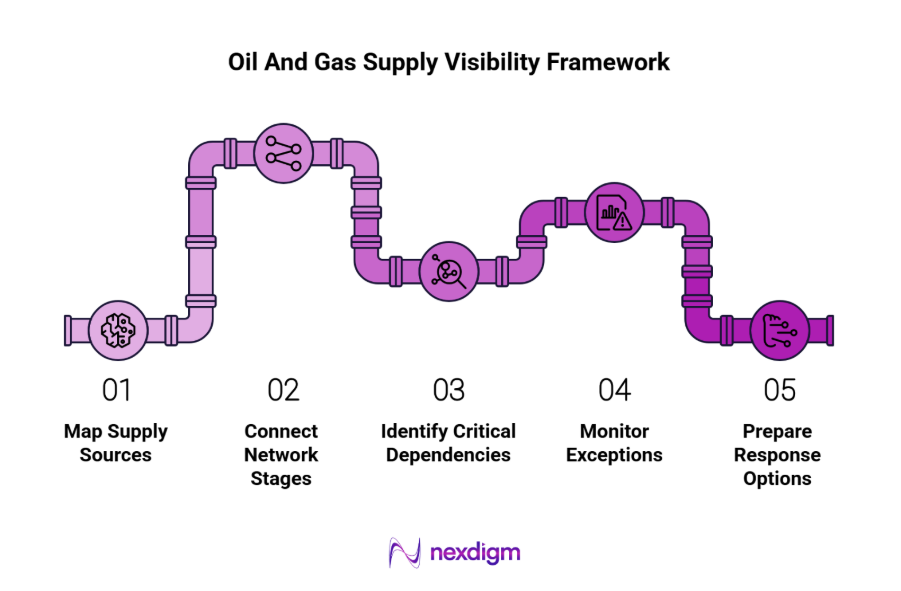
- Map Supply Sources: Identify producing assets, suppliers, processing facilities and contracted volumes.
- Connect Network Stages: Link production, inventory, transport, terminal and delivery information.
- Identify Critical Dependencies: Assess supplier concentration, route exposure and infrastructure constraints.
- Monitor Exceptions: Track production shortfalls, delayed cargoes and inventory deviations.
- Prepare Response Options: Evaluate alternative suppliers, routes, inventory buffers and contractual flexibility.
Nexdigm’s Case Study: Identifying A Downstream Supply Risk
A fuel distributor connects supplier schedules, terminal inventory and vessel arrival data. The combined view identifies a potential gap between an expected cargo arrival and a refinery’s planned requirement. Procurement secures alternative supply while logistics revises delivery schedules to reduce the risk of a downstream shortage.
End-to-end visibility helps energy businesses identify risks before they become delivery failures. Connecting operational data with trade and contract information supports more informed procurement, contingency planning and allocation decisions across the supply chain.
To take the next step, simply visit our Request a Consultation page and share your requirements with us.
Harsh Mittal
+91-8422857704