

Oil and gas trade is entering a period of significant reconfiguration. The IEA reports that global gasoil and diesel exports averaged 4.7 million barrels per day during the first nine months of 2026, 10% below the previous year, while U.S. LNG exports averaged 17.4 billion cubic feet per day in the first half of 2026, 23% higher year-on-year. At the same time, Gulf crude exports surged by 4.4 million barrels per day to 13.9 million barrels per day in September as supply partially recovered.
These contrasting movements show why oil and gas trade data analysis can reveal more than the direction of energy flows. Changes in suppliers, destinations, products, pricing, and shipment activity can expose market gaps, sourcing shifts, competitive movements, and opportunities that may not be visible through headline market statistics.
Trade Flows Can Tell a Bigger Market Story
Oil and gas trade patterns often reflect several forces at once. A sudden rise in imports may point to stronger demand, lower domestic production, inventory rebuilding, or a temporary supply disruption. Likewise, declining exports may signal production constraints or changing domestic priorities. Looking at these movements over time and across suppliers and destinations helps businesses understand what is actually changing.
New Suppliers Can Change Established Sourcing Patterns
Energy markets can quickly adjust when traditional suppliers face disruptions or when new production and export capacity becomes available. U.S. LNG exports, for example, increased significantly in 2026 as new and expanded terminals added capacity. Such changes can create alternative sourcing options and alter competitive relationships across destination markets.
- Emerging Sources: Identify suppliers and origins gaining importance as established trade relationships change.
- Market Gaps: Find destinations where changing demand, supply constraints, or limited supplier diversity may create opportunities.
Tracking emerging suppliers and market gaps can help businesses identify new sourcing opportunities, strengthen supply resilience, and respond more effectively to shifting competitive dynamics across global energy markets.
Nexdigm’s Approach to Assessing Oil and Gas Trade Movements
Trade flows show where energy is moving. The more important question is what those movements mean for a business. Nexdigm brings trade data together with market, supplier, pricing, competitive, and supply-chain intelligence to:
- Read the Market: Examine changing imports, exports, demand, suppliers, and destinations to identify meaningful market movements.
- Connect the Signals: Link trade flows with pricing, infrastructure, company activity, and supply conditions to understand what is driving the change.
- Turn Insights into Action: Use the findings to identify sourcing options, market gaps, competitive shifts, and areas for strategic growth.
This approach helps businesses move from seeing changes in energy trade to understanding where those changes could create opportunity or exposure.
Why Businesses Partner with Nexdigm
Nexdigm combines trade intelligence, energy-sector knowledge, market research, pricing analysis, competitive intelligence, company research, and supply-chain expertise to conduct oil and gas trade data analysis.
This enables businesses to move beyond asking “what is being traded?” and understand where market gaps are emerging, which suppliers are gaining relevance, how sourcing patterns are changing, and where commercial opportunities may exist.
Nexdigm’s Oil and Gas Trade Data Analysis Framework
Nexdigm can structure oil and gas trade data analysis around the commercial realities of the energy industry. The framework connects trade flows with upstream supply, refining, midstream infrastructure, downstream demand, pricing, and competitive dynamics to identify actionable opportunities and risks through the following steps:
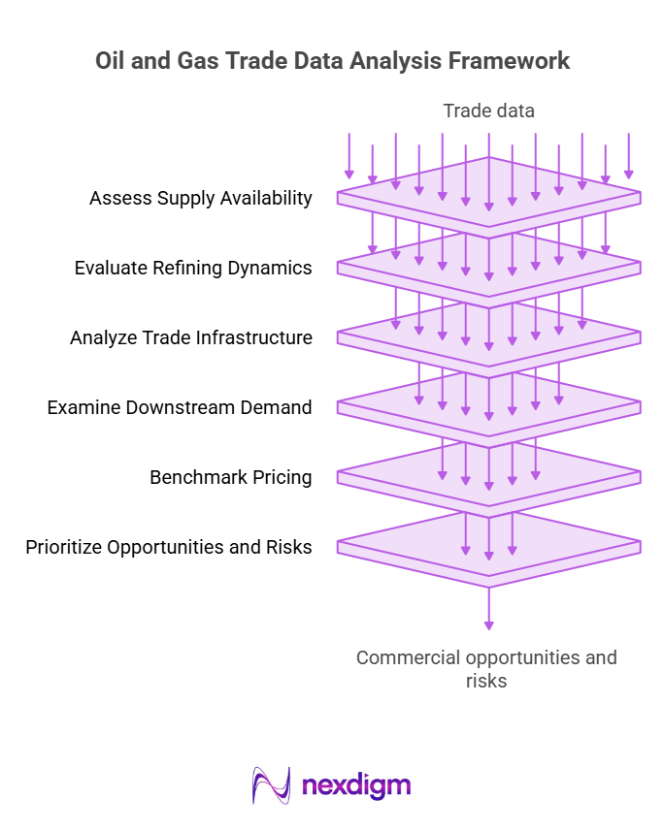
- Assess Production and Supply Availability: Map crude oil and gas production, exporting countries, production capacity, supplier participation, and supply growth to understand where energy availability is increasing or becoming constrained.
- Evaluate Refining and Processing Dynamics: Analyze refinery capacity, utilization, refined-product exports, product demand, and processing trends to understand how crude and gas availability translate into downstream trade opportunities. This can reveal markets where specific refined products are becoming more attractive, or supply is tightening.
- Analyze Midstream and Trade Infrastructure: Assess pipelines, LNG terminals, ports, storage facilities, shipping routes, and major trade corridors to determine how easily oil and gas can move between suppliers and destination markets. This highlights infrastructure constraints, route dependencies, and potential market-access advantages.
- Examine Downstream Demand and Market Gaps: Evaluate import dependence, consumption patterns, buyer activity, product demand, pricing, and market growth to identify where downstream requirements may be increasing or remaining underserved. This can help companies prioritize attractive destination markets and product opportunities.
- Benchmark Pricing and Competitive Position: Compare trade prices, supplier shares, company participation, origins, destinations, and competitive movements to understand market economics and the relative positioning of industry participants.
- Prioritize Commercial Opportunities and Risks: Combine supply, refining, infrastructure, demand, pricing, and competitive findings to identify new markets, alternative suppliers, sourcing opportunities, trade corridors, supply risks, and investment priorities.
Nexdigm’s structured framework provides businesses with an industry-specific view of where oil and gas trade is changing and what businesses can do about it.
Nexdigm’s Case
Nexdigm supported an energy-sector client in evaluating markets across 6 regions, analyzing 50+ trade, pricing, supply, and infrastructure indicators. The assessment shortlisted 8 priority markets, identified 12 potential supply sources, and highlighted 3 high-priority trade corridors, strengthening the client’s market-expansion and sourcing strategy.
To take the next step, simply visit our Request a Consultation page and share your requirements with us.
Harsh Mittal
+91-8422857704