

Global oil and gas trade continues to evolve as production, consumption, infrastructure, and sourcing relationships change across regions. In 2025, global LNG trade reached around 438 million tonnes, while the U.S. exported approximately 113 million tonnes, making it the largest LNG exporter. Global oil demand also remained above 100 million barrels per day.
These movements show the scale of energy moving between producing and consuming markets. Oil and gas trade flow analysis can help businesses track where supply is coming from, where demand is growing, how trade routes are changing, and where new sourcing or market opportunities may emerge.
What Changing Energy Flows Can Reveal
Trade movements can provide several practical signals when analysed across suppliers, buyers, products, and markets:
- Changing Demand: Rising imports can indicate stronger consumption, refinery requirements, or increasing dependence on external supply.
- Shifting Supply: Export growth can highlight new suppliers, expanding production, or additional LNG and crude availability.
- Changing Trade Routes: Shifts in origins, destinations, ports, pipelines, and shipping corridors can reveal changing market access and sourcing relationships.
These signals provide a starting point for understanding where global energy flows are changing and what those movements could mean for businesses.
From Energy Flows to Commercial Signals
The direction of oil and gas flows can reveal changing buyer preferences, supplier relationships, and market opportunities. Growing imports may indicate rising demand or limited domestic supply, while new sourcing origins can signal diversification. Shifts in destinations may also reflect pricing, infrastructure, or competitiveness. Reading these movements together helps businesses understand where energy markets are gaining strategic relevance.
Nexdigm’s Role in Assessing Global Energy Flows
Nexdigm brings together trade intelligence, energy-market research, pricing analysis, competitive intelligence, and supply-chain insights to interpret these changing flows. Rather than examining shipment data in isolation, Nexdigm connects suppliers, buyers, demand, pricing, infrastructure, and trade routes to understand the commercial meaning behind energy movements.
This approach helps businesses identify where flows are changing, what is driving those changes, and which markets or sourcing relationships warrant closer strategic attention.
What Nexdigm Examines Across Energy Trade Flows
Nexdigm looks beyond shipment volumes to understand the factors influencing where oil and gas originate, where they are consumed, and how those relationships are changing.
- Supply and Demand: Analyze production, imports, exports, consumption, refinery requirements, LNG capacity, and buyer activity to identify changing market balances.
- Trade and Pricing: Examine origins, destinations, suppliers, buyers, trade values, pricing, and shipment patterns to understand changing commercial relationships.
- Infrastructure and Routes: Assess pipelines, ports, terminals, storage, shipping corridors, and logistics to determine how infrastructure affects market access and supply resilience.
- Competitive Positioning: Track supplier participation, market shares, company activity, and destination coverage to identify emerging competitors and changing trade relationships.
Together, these areas create the foundation for a structured oil and gas trade flow analysis, helping businesses connect global energy movements with practical commercial decisions.
Nexdigm’s Global Energy Trade Flow Assessment
Nexdigm can structure the assessment across four connected areas to turn fragmented oil and gas trade information into a clearer view of market movement, supply exposure, demand shifts, and commercial opportunity.
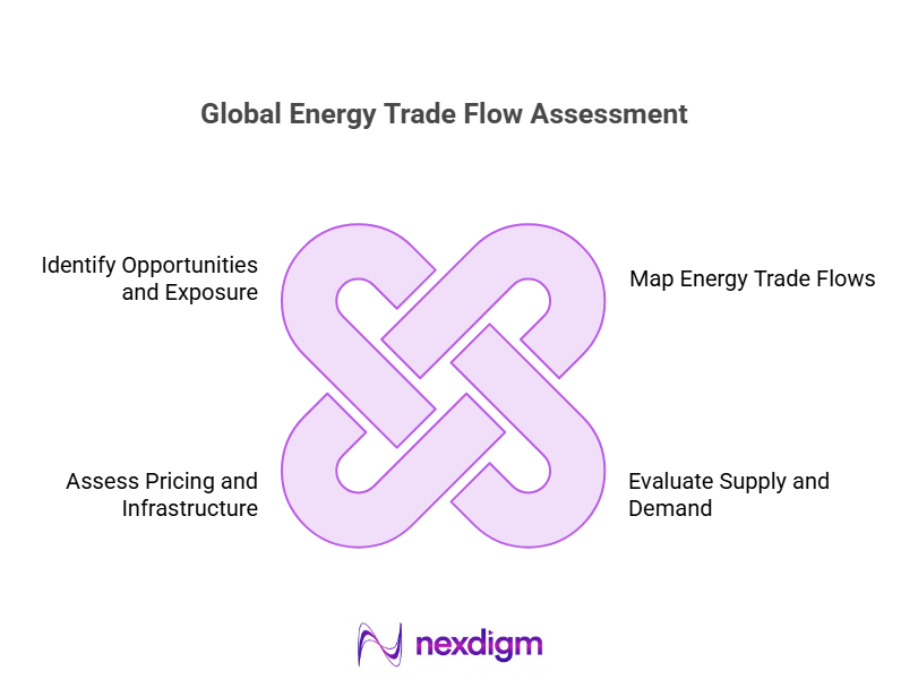
- Map Energy Trade Flows: Analyze imports, exports, shipment volumes, origins, destinations, suppliers, buyers, and trade frequency to establish how oil and gas are moving across major markets.
- Evaluate Supply and Demand: Assess production, consumption, refinery requirements, LNG capacity, import dependence, storage, and buyer activity to understand the factors driving changing trade flows.
- Assess Pricing, Infrastructure, and Routes: Examine trade values, indicative pricing, pipelines, ports, terminals, storage, shipping corridors, and logistics to determine the economics and accessibility of different trade relationships.
- Identify Opportunities and Exposure: Combine trade, market, pricing, infrastructure, and competitive findings to identify emerging markets, alternative suppliers, high-potential corridors, and supply or route dependencies.
The framework connects what is moving, where it is moving, why it is moving, and what it means commercially. This gives businesses a stronger basis for sourcing, market expansion, diversification, and risk-management decisions.
Nexdigm’s Case
Nexdigm supported an energy-sector client by analyzing 18,000+ oil and gas trade records across 15 markets, covering 35+ suppliers, multiple origin-destination combinations, and pricing and infrastructure indicators. The assessment identified high-potential trade corridors and 16 supplier relationships for deeper evaluation, supporting more targeted sourcing and market-prioritization decisions.
To take the next step, simply visit our Request a Consultation page and share your requirements with us.
Harsh Mittal
+91-8422857704