

Oil and gas markets are currently experiencing significant shifts in supply, demand, pricing, and trade routes. The IEA’s October 2026 Oil Market Report estimates global oil supply at 102.3 million barrels per day in September, up 2.5 million barrels per day month-on-month, while 2026 global oil demand is forecast to decline by 2.6 million barrels per day. Global observed oil inventories were also 509 million barrels below end-February levels by September. At the same time, global diesel exports in September were approximately 700,000 barrels per day lower year-on-year, highlighting the pressure on refined-product trade.
These movements demonstrate why import-export records can be valuable beyond simple trade-volume tracking. Oil and gas trade intelligence can help businesses understand where supply is moving, which markets are becoming more dependent on imports, which suppliers are gaining or losing relevance, how pricing is changing, and where competitive opportunities or supply risks may be emerging.
Trade Data Can Reveal Changes
Import and export movements can provide early signals of changing market conditions. Rising imports may indicate stronger demand, declining domestic production, inventory rebuilding, or temporary supply shortages. Similarly, changes in export shares can reveal new production centres or shifts in supplier competitiveness. Analyzing values, volumes, origins, destinations, and companies together provides a more reliable interpretation than headline trade figures alone.
Supplier and Competitor Movements Add Another Layer
Energy trade data can show how commercial relationships are changing across countries and companies. The IEA reported that Gulf crude exports increased by 4.4 million barrels per day to 13.9 million barrels per day in September, while U.S. and Chinese exports helped partly offset losses from Russia and the Middle East in diesel markets.
- Supplier Signals: Track exporters, origins, shipment activity, and market shares to identify changing supply positions.
- Competitor Signals: Map companies, buyers, pricing, and trade relationships to understand evolving competitive structures.
Nexdigm’s Oil and Gas Trade Intelligence Approach
Nexdigm combines trade intelligence with energy-sector research, market intelligence, competitive analysis, pricing assessment, company intelligence, and supply-chain research. Our oil and gas trade intelligence can examine crude oil, refined petroleum products, natural gas, LNG, suppliers, buyers, origins, destinations, shipment activity, trade values, volumes, and indicative pricing.
Rather than treating import-export data as the final answer, experts at Nexdigm can connect trade movements with production capacity, infrastructure, logistics, market demand, company activity, regulatory conditions, and competitive dynamics.
This creates a broader view of why trade patterns are changing and what those changes could mean for sourcing, market entry, procurement, competitor positioning, and investment decisions.
Why Nexdigm’s Oil and Gas Trade Intelligence Approach Stands Out
Nexdigm’s strength lies in connecting trade data with the wider commercial context. Rather than viewing import-export records in isolation, its approach combines multiple intelligence sources to explain the market movements through:
- Trade Data with Industry Context: Nexdigm connects trade flows with energy-sector research, production, infrastructure, demand, regulations, and market conditions to interpret why trade patterns are changing.
- Supplier and Competitor Intelligence: Supplier shares, company activity, buyer relationships, pricing, and sourcing patterns are assessed together to provide a clearer view of competitive and supply dynamics.
- Insights Linked to Business Decisions: Analysis is translated into practical priorities across sourcing, market entry, supplier diversification, procurement, competitor positioning, and investment planning.
This integrated approach helps businesses move beyond tracking oil and gas trade flows to understand their commercial implications and identify where strategic action may be required.
Nexdigm’s Oil and Gas Trade Intelligence Assessment
Nexdigm can structure the assessment through five connected stages, moving from trade data to strategic interpretation. These stages are:
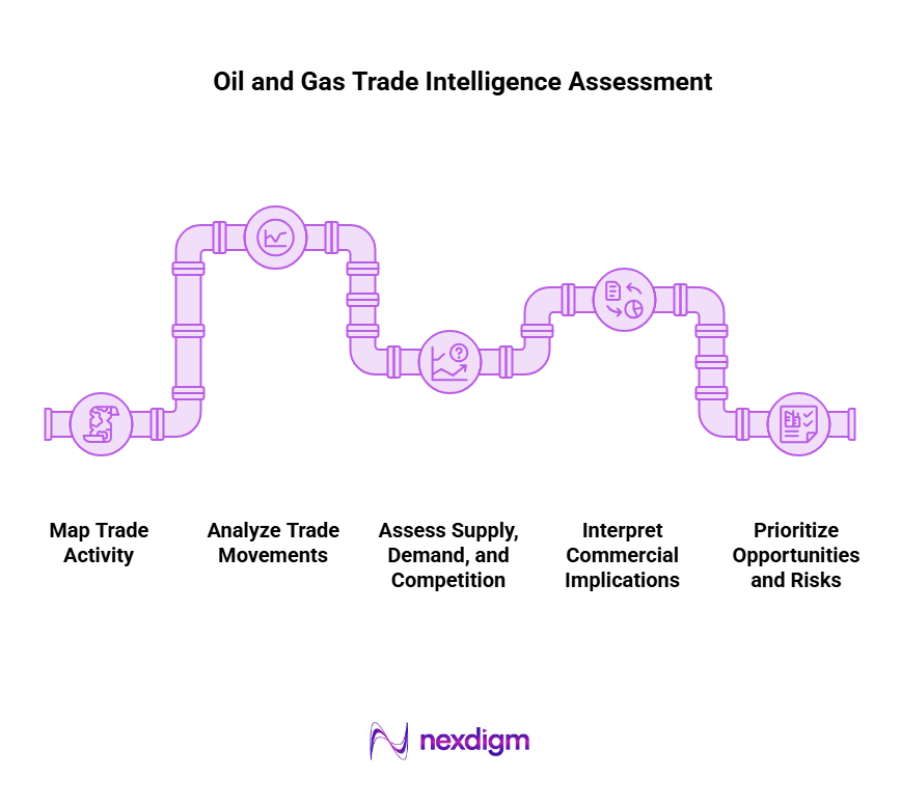
- Map Trade Activity: Identify the relevant energy products, countries, suppliers, buyers, origins, destinations, trade routes, and time periods. This establishes the overall structure of the market and highlights the major participants and trade corridors.
- Analyze Trade Movements: Assess import and export values, volumes, growth rates, shipment frequency, supplier shares, buyer participation, and indicative pricing. This helps identify significant changes in market activity and commercial relationships.
- Assess Supply, Demand, and Competition: Evaluate production, import dependence, supplier capacity, market demand, company participation, competitive positioning, and sourcing concentration. This provides context for understanding what is driving observed trade movements.
- Interpret Commercial Implications: Connect trade findings with pricing, infrastructure, logistics, regulations, company intelligence, and market conditions to determine why changes are occurring. This step separates meaningful market signals from temporary fluctuations.
- Prioritize Opportunities and Risks: Rank markets, suppliers, products, and trade relationships based on demand potential, supply availability, pricing, competition, accessibility, and strategic relevance.
This assessment helps convert complex import-export information into a structured view of market opportunities, supplier alternatives, competitive shifts, and potential exposure.
Nexdigm’s Case
Nexdigm’s trade intelligence approach helped a manufacturer identify market shifts, contributing to 18% export-volume growth, 24% higher distributor orders, and 15% fewer inventory gaps. The analysis supported faster demand forecasting, stronger sourcing decisions, and more informed international market planning.
To take the next step, simply visit our Request a Consultation page and share your requirements with us.
Harsh Mittal
+91-8422857704