

Oilfield services demand is often discussed through rig counts, but active rigs capture only part of the market. Operators also purchase completion equipment, workovers, artificial lift, production chemicals, maintenance, digital monitoring and asset-integrity services. Suppliers planning where to compete need to understand how activity converts into service demand by work scope, basin and asset type.
Investment patterns point in different directions. The International Energy Agency expects global oil investment to fall below $500 billion in 2026, its third consecutive annual decline, while natural gas investment is projected to reach $330 billion. At the same time, nearly 90% of upstream oil and gas investment since 2019 has gone toward offsetting declines at existing fields. The IEA’s analysis of about 15,000 fields found average observed post-peak decline rates of 5.6% for conventional oil and 6.8% for conventional gas. Deep offshore oil fields averaged a faster decline rate of 10.3%.
Those conditions support distinct service markets:
- Drilling: New wells, infill programs and development campaigns create demand for rigs, directional services, bits, fluids, logging and well construction.
- Completion: Casing, cementing, stimulation, perforating, sand control and flowback services are needed to bring wells online. Completion intensity can matter as much as well count.
- Well intervention: Workovers, coiled tubing, wireline, slickline, well-integrity work and artificial lift can restore production or extend asset life.
- Production support: Chemicals, compression, water handling, rotating equipment, monitoring and maintenance support uptime and recovery.
Translate Activity Into Service Intensity
Recent U.S. production data show why rig counts alone can mislead. The Energy Information Administration reports that U.S. crude production reached a record 13.6 million barrels per day in 2025 even as active rigs in the Lower 48 declined 5% and drilled wells fell 1% from 2024. Efficiency gains helped offset lower activity. A supplier tracking rig totals without considering productivity, completions and the installed base of producing wells can miss where spending is moving.
A strong oilfield services demand assessment research program segments demand by geography, asset maturity, well type, operator economics and procurement model. It estimates activity and service content within each segment. Planned well counts, for example, need to be translated into expected equipment, crew time, consumables and specialist services. Producing assets require a different estimate based on decline, water production, lift requirements, maintenance history and uptime targets.
The assessment should distinguish announced activity from work likely to proceed. Operator budgets, permits, rig deployments, tenders and contract awards provide different degrees of confidence. Probability-weighting the pipeline gives a more credible view of accessible demand than treating every announced project as committed. It also helps suppliers distinguish spending exposed to capital budgets from recurring service needs tied to existing production.
Competitive analysis matters at the same level of detail. Local capacity, equipment utilization, crew availability, mobilization costs, contract terms and payment risk determine whether a market opportunity is commercially reachable. A basin may show strong activity but already have enough qualified suppliers. Another may have lower headline demand but offer better margins or a repeat-service advantage.
Framework: Convert Basin Activity Into Addressable Service Demand
Nexdigm can use this five-step framework to rank opportunities by service line and determine where a supplier can compete profitably.
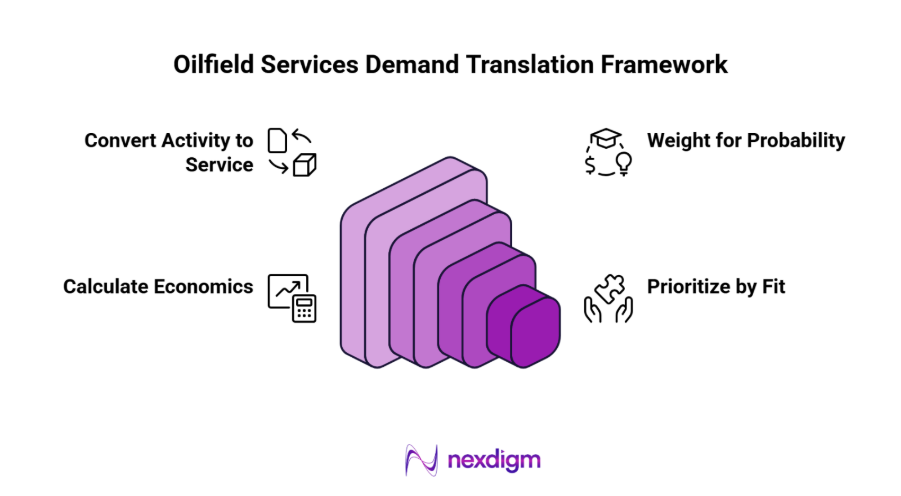
- Build the Activity Baseline
Estimate drilling, completions, interventions and producing-asset activity by basin and forecast period. Separate historical activity from planned work and record the source and confidence level for each forecast input. - Convert Activity Into Service Requirements
Estimate the equipment, crews, technology and consumables required for each well or asset. Account for well type, lateral length, water depth, reservoir conditions and local operating practices where relevant. - Weight for Funding and Award Probability
Adjust announced activity for budget approval, permits, tender status, contract awards and likely execution timing. Create base and downside cases so the opportunity does not depend on every planned project proceeding. - Calculate Accessible Economics
Estimate serviceable spend, expected pricing, utilization, mobilization cost, margin and payment risk. Compare the required capabilities with the supplier’s current equipment, workforce and local partnerships. - Prioritize by Fit and Repeatability
Rank opportunities based on contribution potential, execution readiness and the chance of repeat work. A smaller intervention market may be more attractive than a larger drilling campaign if it offers recurring demand and fits existing capabilities.
Nexdigm Case Study
Nexdigm modelled service demand across 85 producing assets and 1,600 potential workovers in three mature Indian basins. The scenario identified $1.4 billion in three-year addressable spend, with intervention and artificial lift representing 37%. We recommended prioritizing recurring lift and water-handling needs, supported by local partners and performance-linked proposals.
To take the next step, simply visit our Request a Consultation page and share your requirements with us.
Harsh Mittal
+91-8422857704