

Petrochemical opportunity is not determined by total oil demand alone. The key question is which products can attract durable demand while supporting competitive feedstock, conversion and delivery costs.
Global oil demand grew by about 0.65 million barrels per day in 2025.
The increase came largely from petrochemicals and aviation, while road transport growth remained muted. That divergence makes product-level analysis essential: a stronger outlook for petrochemical feedstocks does not guarantee attractive economics for every polymer or chemical intermediate.
The feedstock picture is also changing.
The United States exported a record 3.1 million barrels per day of natural gas liquids in 2025, including record propane exports.
That scale of supply creates options for export-oriented producers, but it also raises the bar for projects that depend on imported feedstock or distant customers.
Start with the customer and end market
Product demand should be traced to its consuming industries. Packaging, construction, automotive, electronics, healthcare and agriculture have different growth drivers, specifications and exposure to economic cycles.
A product with broad demand can still face price pressure if capacity is expanding faster than customer demand.
Map consumption by product, grade and geography, then compare it with domestic production, imports, exports and announced capacity. Separate structural demand from short-term restocking. Customer interviews and distributor checks can reveal whether buyers value price, consistent quality, local availability, technical support or security of supply.
A robust petrochemical opportunity assessment consulting process also tests substitution. Recycled materials, bio-based feedstocks and product redesign may constrain demand in some applications while creating new requirements in others. The commercial question is whether a producer can meet a specific customer need at a competitive delivered cost.
Feedstock and operating costs shape the margin
Feedstock access is a strategic advantage only when it translates into reliable, usable supply. Compare gas liquids, naphtha and other potential inputs on delivered cost, quality, seasonality, infrastructure access and exposure to price volatility. A low-cost feedstock source can lose its advantage through freight, storage constraints or an incompatible process configuration.
Then build product-level economics. Include conversion yields, energy, labor, maintenance, logistics, taxes and working capital. Test normal and downside cases for feedstock spreads, product prices, utilization and freight. A high headline margin during a supply disruption should not anchor a long-term investment case.
Capacity utilization is another warning signal. If existing plants are operating below practical levels, planned capacity additions need a clear differentiation or cost advantage. Conversely, a local supply gap may support investment where buyers face long lead times, import risk or high delivered costs.
Prioritize products with defensible routes to market
The strongest opportunities often combine a growing end use with a clear cost or customer advantage. That advantage might come from feedstock integration, a lower-cost production route, proximity to customers, reliable logistics or the ability to supply a specialized grade.
Compare investment choices across the value chain. A company may create more value by debottlenecking an existing unit, changing its product slate, securing long-term feedstock or building customer-specific capabilities than by adding undifferentiated capacity.
Framework: Product-to-Margin Opportunity Screen
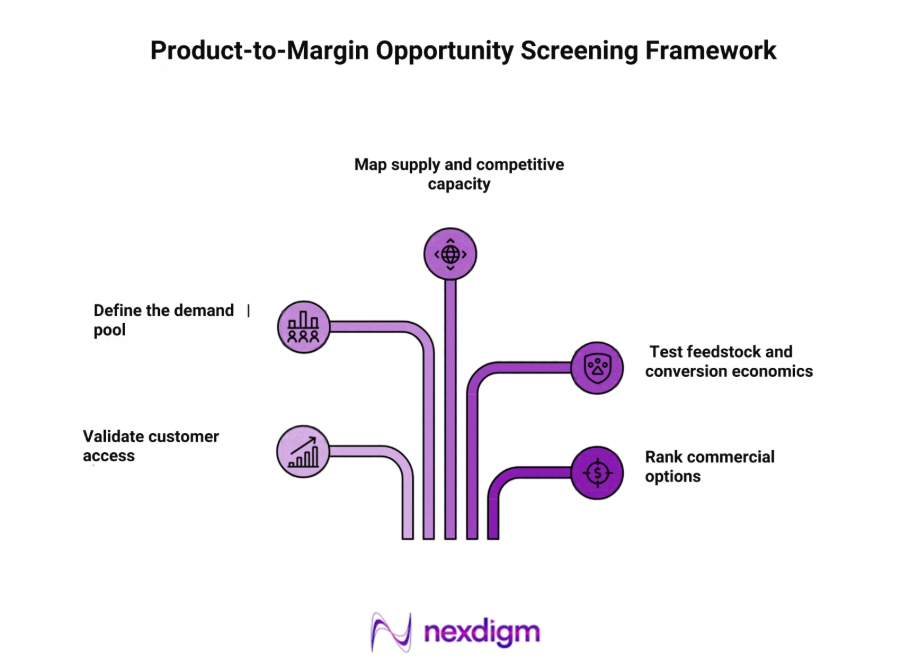
- Define the demand pool
Size product demand by application, customer segment and region. Separate durable growth from cyclical recovery and inventory movements. - Map supply and competitive capacity
Compare current output, imports, exports, utilization and announced projects. Identify where capacity additions could weaken pricing. - Test feedstock and conversion economics
Model delivered feedstock cost, yields, energy use, logistics and operating costs under base and downside assumptions. - Validate customer access
Confirm required specifications, switching barriers, purchase criteria, qualification timelines and realistic customer volumes. - Rank commercial options
Compare new capacity, upgrades, product shifts and supply partnerships by risk-adjusted returns and time to market.
Nexdigm Case Study
Nexdigm assessed 4 petrochemical product groups across 3 export-oriented markets, comparing demand growth, feedstock access, capacity utilization and delivered margins. Our model identified1 product group where customer demand was growing faster than local supply and where the target plant could reach 84% utilization after a phased upgrade.
A competing product case fell below the client’s margin threshold when freight and feedstock costs were stressed. We recommended prioritizing the upgrade, securing two anchor customer agreements and staging further capacity against verified offtake.
To take the next step, simply visit our Request a Consultation page and share your requirements with us.
Harsh Mittal
+91-8422857704