
The Philippines private education sector continues to expand alongside rising household education spending and strong demand for quality schooling options. Recent national education data indicate about 2.15 million learners enrolled in private basic education institutions, reflecting sustained participation despite a large public system and highlighting the scale of the private segment in the country’s education landscape.
In a competitive private education environment, perceived quality and student experience strongly influence school choice and brand reputation. Customer satisfaction measurement helps institutions understand expectations around teaching quality, facilities, outcomes, and engagement, enabling targeted improvements that strengthen positioning and long-term enrollment stability.
Benefits of a Customer Satisfaction Survey In Private Education
-
Brand perception clarity
Structured consumer feedback reveals how parents and students view academic quality, facilities, and outcomes, helping institutions refine brand messaging and positioning with evidence-based insights aligned to market expectations.
-
Enrollment and retention insights
Satisfaction drivers across admissions, teaching, and campus experience show why families enroll or switch schools. Nexdigm-led analytics translate these into actionable levers that support sustained enrollment growth.
-
Service quality improvement
Detailed journey feedback across teaching, administration, and support functions highlights gaps affecting experience consistency. Institutions can prioritize improvements that directly enhance satisfaction and perceived value.
-
Competitive differentiation signals
Benchmarking against peer institutions uncovers unique strengths and weaknesses in curriculum, pedagogy, and engagement. Nexdigm frameworks enable schools to differentiate offerings in crowded urban education markets.
-
Stakeholder trust and credibility
Demonstrating responsiveness to feedback builds trust with parents and students. Regular satisfaction tracking shows commitment to quality, reinforcing institutional credibility and long-term brand equity.
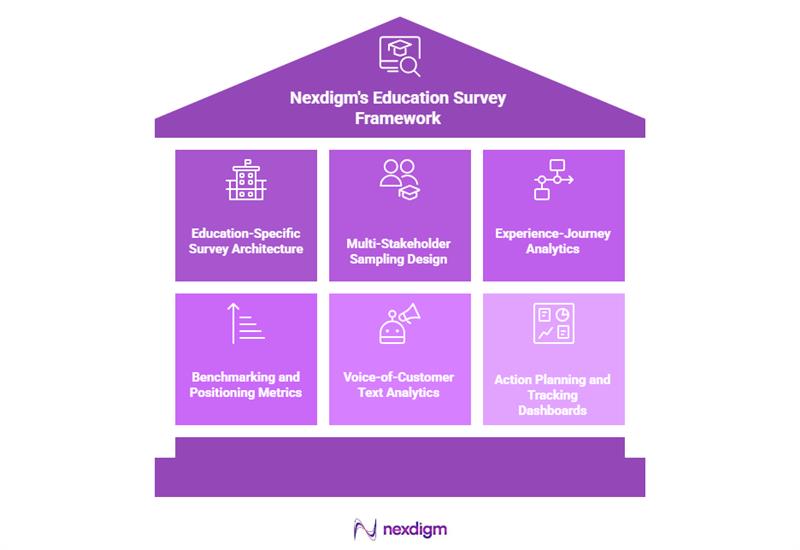
Nexdigm Approach to Philippines Education Customer Satisfaction Surveys
-
Education-specific survey architecture
Nexdigm designs questionnaires covering academic quality, faculty engagement, infrastructure, safety, and outcomes, ensuring relevance across K-12 and higher education contexts within the Philippines market.
-
Multi-stakeholder sampling design
Surveys capture perspectives of parents, students, alumni, and staff to reflect the full education experience ecosystem. Stratified sampling ensures representation across grade levels, programs, and locations.
-
Experience-journey analytics
Touchpoints from inquiry to graduation are mapped and scored to identify satisfaction drivers and pain points. Statistical modeling isolates factors most influencing loyalty and recommendation behavior.
-
Benchmarking and positioning metrics
Institutions are compared against local and international school benchmarks on satisfaction, teaching quality, and facilities. This reveals competitive positioning gaps and differentiation opportunities.
-
Voice-of-customer text analytics
Open-ended responses are analyzed using sentiment and theme extraction to uncover nuanced expectations on pedagogy, communication, and campus life beyond numeric ratings.
-
Action planning and tracking dashboards
Nexdigm converts findings into prioritized improvement roadmaps with KPIs and dashboards. Institutions track satisfaction changes over time, linking experience improvements to enrollment and brand outcomes.
Nexdigm Case
A mid-tier private K-12 school network in Metro Manila engaged Nexdigm to assess declining retention and brand perception. The survey covered 1,200 parents and students across five campuses and showed overall satisfaction at 68/100, below the regional private school benchmark of 74. Nexdigm analysis identified teaching consistency and parent communication as key gaps. After targeted faculty training and a digital parent-engagement platform rollout, reenrollment intent rose from 71 percent to 83 percent within one academic cycle, with new admissions inquiries increasing 19 percent.
To take the next step, simply visit our Request a Consultation page and share your requirements with us.
Harsh Mittal
+91-8422857704