
The Education Product Survey is designed to evaluate how students, educators, and institutional buyers interact with and select education products in a dynamic global market. The survey collects structured feedback on digital platforms, textbooks, assessment tools, and support services to identify preferences and unmet needs.
The Philippines Education Product Survey provides actionable insights into the evolving demands of students, parents, and educators. By capturing data on usage, satisfaction, and feature preferences, businesses can tailor product offerings, optimize service delivery, and enhance customer satisfaction in the education sector.
The global education product market comprises learning technology companies, content developers, and analytics providers competing with agile startups offering personalized, data-driven solutions. Product survey insights guide innovation, pricing strategies, localized content development, and partnership approaches to refine offerings and improve the overall user experience.
Institutional Positioning on Education Product Survey Consumer Preference
Product surveys in the education sector provide essential insights into consumer preferences, helping institutions and businesses tailor their education products to meet market demands. These surveys support improvements in product design, functionality ,and positioning, driving institutional success.
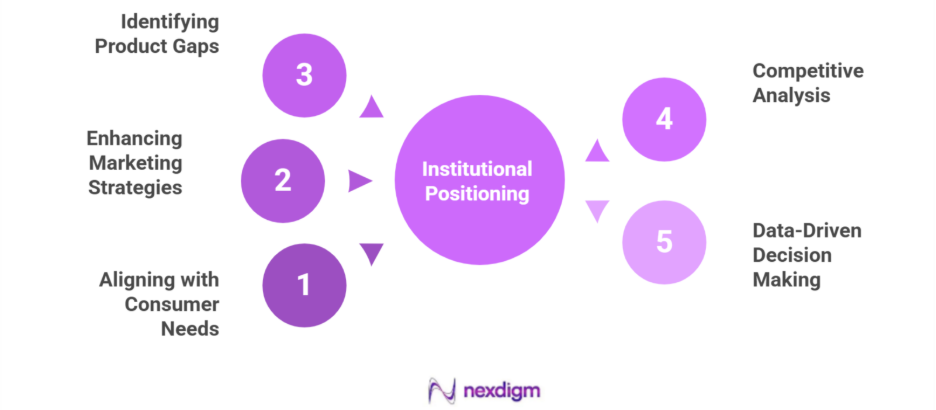
Aligning with Consumer Needs
Education product surveys help institutions understand the needs of students, educators, and institutional buyers, ensuring products, platforms, and tools are relevant, user-focused, and aligned with learning objectives.
Enhancing Marketing Strategies
Insights from product surveys enable institutions to refine marketing campaigns, target the right audience effectively, and communicate product benefits clearly, increasing engagement and adoption of educational offerings.
Identifying Product Gaps
Survey analysis highlights areas where existing educational products or services underperform, prompting innovation, feature enhancements, and development of solutions that better address market needs.
Competitive Analysis
Product surveys provide data on competitors’ offerings, strengths, and weaknesses, helping institutions differentiate their products, improve positioning, and gain a competitive edge in the education sector.
Data-Driven Decision Making
Survey insights offer actionable guidance for strategic decisions on product development, service improvements, and market expansion, enabling institutions to prioritize initiatives that deliver maximum value to users.
Nexdigm’s Approach to Product Survey Services
Nexdigm leverages its deep expertise in market research to seamlessly integrate consumer preference surveys into the educational sector. By understanding the unique challenges of education institutions, Nexdigm tailors surveys to capture detailed insights, enabling organizations to adapt and refine their offerings effectively. This approach ensures that education products align with the evolving needs of students and educators.
Through its data-driven methodology, Nexdigm enhances the decision-making process for educational institutions. By providing actionable insights, Nexdigm enables clients to stay ahead of competitors. Its commitment to innovation and customer satisfaction ensures that survey services not only meet but exceed expectations, fostering long-term partnerships and positioning clients strategically for sustained growth.
Nexdigm’s Case:
Nexdigm helped an education provider increase product adoption by 27% through an education product survey, capturing feedback from 2,500 students. Survey insights reduced churn by 18% and guided feature updates, improving product satisfaction scores from 3.8 to 4.6 out of 5.
To take the next step, simply visit our Request a Consultation page and share your requirements with us.
Harsh Mittal
+91-8422857704